It is important to watch the DXY to understand the strength of the USD across global markets.
The DXY is a key index that reflects the U.S. dollar’s dominance in foreign exchange. Therefore, tracking it can provide valuable insights into the potential direction of all major asset classes.
In this post, I’ll break down both technical and fundamental expectations.
Technical Analysis
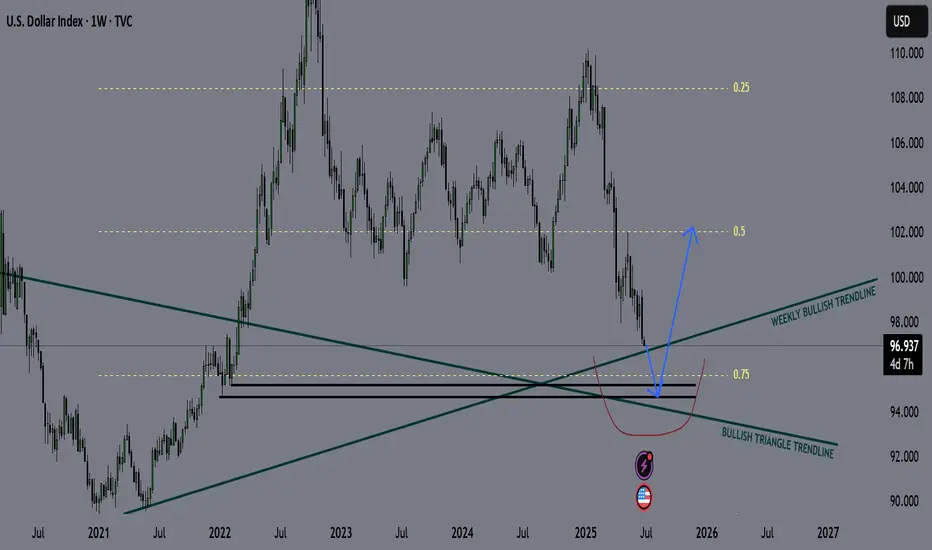
DXY has been in a retracement phase (bearish) since January 2025. During this time, we’ve seen EUR and other major forex pairs form strong bullish trends.
Currently, the DXY is approaching a weekly bullish trendline, where I expect a potential bounce.
Additionally, DXY is trading within a discount zone (below the 0.5 Fibonacci level, also known as equilibrium). Personally, I’m watching for a deeper move into the maximum discount zone (around the 0.75 Fib level).
This area also aligns with key liquidity concepts. Ideally, I want to see a deviation below the bullish trendline, with a sweep of one of the weekly liquidity levels marked on the chart (two black horizontal lines).
I'm not relying on a clean triangle trendline retest, but it's a possibility.
Game Plan
Once that setup completes, I’ll be expecting strong USD performance, and will look to short risk assets — including stocks and major forex pairs.
Fundamental Analysis
The Federal Reserve is currently resisting pressure to cut interest rates, while Trump is vocally pushing for rate cuts.
The market is already pricing in a 79% probability of a September rate cut (source: CME FedWatch Tool), so if that happens as expected, I don’t anticipate major market reaction.
However, a surprise rate cut in July would likely trigger a flash crash in DXY/USD — though based on my game plan, I would expect a V-shaped recovery shortly afterward.
EUR, GBP, AUD, and CAD have also hit key resistance zones, so I believe we're likely to see USD strength for a while.
The DXY is a key index that reflects the U.S. dollar’s dominance in foreign exchange. Therefore, tracking it can provide valuable insights into the potential direction of all major asset classes.
In this post, I’ll break down both technical and fundamental expectations.
Technical Analysis
DXY has been in a retracement phase (bearish) since January 2025. During this time, we’ve seen EUR and other major forex pairs form strong bullish trends.
Currently, the DXY is approaching a weekly bullish trendline, where I expect a potential bounce.
Additionally, DXY is trading within a discount zone (below the 0.5 Fibonacci level, also known as equilibrium). Personally, I’m watching for a deeper move into the maximum discount zone (around the 0.75 Fib level).
This area also aligns with key liquidity concepts. Ideally, I want to see a deviation below the bullish trendline, with a sweep of one of the weekly liquidity levels marked on the chart (two black horizontal lines).
I'm not relying on a clean triangle trendline retest, but it's a possibility.
Game Plan
- DXY taps the bullish trendline
- Deviates below it, running weekly liquidity (black lines)
- Hits the max discount zone (~0.75 Fib)
- Then shows signs of reversal and strength
Once that setup completes, I’ll be expecting strong USD performance, and will look to short risk assets — including stocks and major forex pairs.
Fundamental Analysis
The Federal Reserve is currently resisting pressure to cut interest rates, while Trump is vocally pushing for rate cuts.
The market is already pricing in a 79% probability of a September rate cut (source: CME FedWatch Tool), so if that happens as expected, I don’t anticipate major market reaction.
However, a surprise rate cut in July would likely trigger a flash crash in DXY/USD — though based on my game plan, I would expect a V-shaped recovery shortly afterward.
EUR, GBP, AUD, and CAD have also hit key resistance zones, so I believe we're likely to see USD strength for a while.
Disclaimer
The information and publications are not meant to be, and do not constitute, financial, investment, trading, or other types of advice or recommendations supplied or endorsed by TradingView. Read more in the Terms of Use.
Disclaimer
The information and publications are not meant to be, and do not constitute, financial, investment, trading, or other types of advice or recommendations supplied or endorsed by TradingView. Read more in the Terms of Use.