⊣
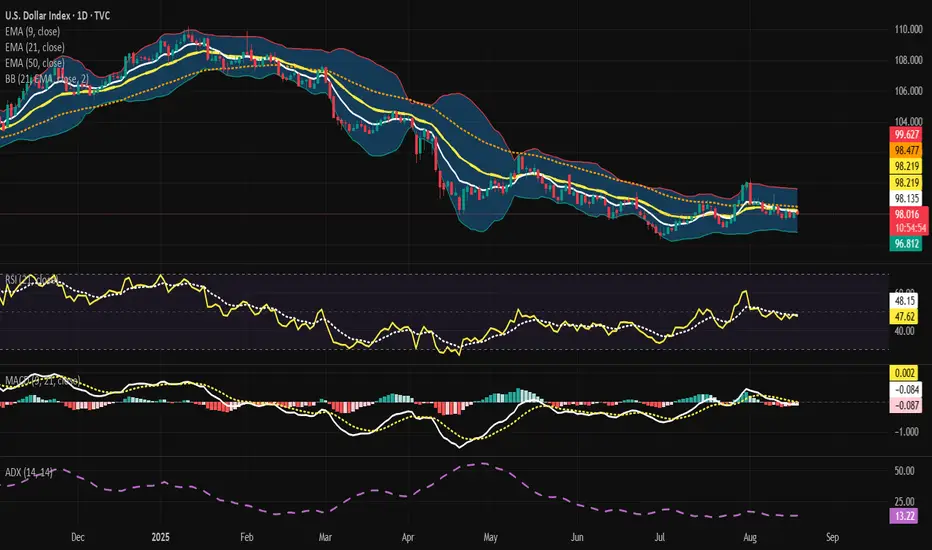
⟁ DXY / U.S. Dollar Currency Index - TVC - (CHART: 1D) - (Aug 19, 2025).
◇ Analysis Price: 98.035.
⊣
⨀ I. Temporal Axis - Strategic Interval - (1D):
✴️Note: The DXY (TVC) does not provide native volume data; therefore, flow-based indicators (OBV, MFI) are substituted by ADX (14) to quantify trend strength.
▦ EMA9 - $98.139:
∴ The current price ($98.035) is positioned below the EMA9 - ($98.139), affirming short-term pressure from sellers;
∴ The slope of the EMA9 is flat to slightly downward, indicating the loss of bullish traction in the most immediate timeframe;
∴ The EMA9 is located beneath both the EMA21 and the EMA50, confirming the presence of a “bearish stacking” alignment.
✴️ Conclusion: The micro-trend remains subdued under short-term resistance. The immediate ceiling is defined at ~98.14, and failure to close above reinforces continuous seller control.
⊢
▦ EMA21 - $98.221:
∴ The price remains below the EMA21, which represents tactical control by sellers in the intermediate horizon;
∴ The fact that EMA9 < EMA21 demonstrates that rebound attempts will likely fail beneath 98.22;
∴ The EMA21 is in direct confluence with the Bollinger Band midline, magnifying the importance of 98.22 as a structural pivot.
✴️ Conclusion: The 98.22 zone is the primary tactical battleground; daily closure above would reduce immediate bearish pressure and open short-term relief potential.
⊢
▦ EMA50 - $98.477:
∴ The price resides below EMA50, and EMA21 is positioned below EMA50, both confirming the persistence of a downward-leaning intermediate trend;
∴ The EMA50 itself is sloping gently downward, acting as a supply zone between $98.45 / $98.50;
∴ Rejections have occurred repeatedly below the $98.5 region, validating this level as the medium-term structural ceiling.
✴️ Conclusion: The $98.45 / $98.50 range is the second barrier; only a sustained close above this threshold neutralizes the existing bearish framework.
⊢
▦ BB (21, 2) - $96.815 / $98.221 / $99.628:
∴ Current price oscillates around the midline ($98.22) but is positioned slightly below, keeping price action inside the lower quadrant of the bands;
∴ Bandwidth is approximately 2.81 points (~2.9% of the midline), which signals suppressed volatility and relative compression;
∴ The upper band at $99.63 and the lower band at $96.82 establish the immediate operational box.
✴️ Conclusion: A compression regime dominates; the probability of false breakouts increases as long as ADX remains below threshold levels.
⊢
▦ RSI (21, 9) - RSI 47.75 / Signal 48.17:
∴ The RSI remains below the neutral 50 line, maintaining a neutral-to-bearish bias;
∴ RSI is positioned beneath its signal line, reinforcing waning momentum;
∴ No oversold or overbought extremes are present, leaving ample room for mean-reversion moves in either direction;
∴ The RSI lost its bullish inclination after the early-August peak, revealing that bullish momentum has dissipated.
✴️ Conclusion: Relative strength is fragile and biased downward; pressure persists, though without signs of exhaustion.
⊢
▦ MACD (9, 21, 9) - MACD Line: −0.085 | Signal: −0.082 | Spread ≈ −0.003:
∴ Both MACD line and Signal line remain below zero, sustaining the negative macro momentum regime;
∴ The spread between MACD and Signal line is marginally negative (−0.003), illustrating momentum compression and indecision;
∴ The histogram bars are shallow, suggesting the likelihood of sideways “chop” until a decisive expansion occurs;
∴ No evidence yet of either bullish or bearish acceleration; instead, momentum is locked in equilibrium.
✴️ Conclusion: Residual bearish momentum persists, but without traction. A valid directional impulse requires expansion of the spread.
⊢
▦ ADX (14) - 13.22:
∴ ADX at 13.22 is significantly below the 20 threshold, confirming a non-trending market;
∴ Under low volatility and low ADX conditions, breakouts tend to fail or reverse, producing whipsaw environments;
∴ Without ADX expansion, directional signals from EMAs, RSI, or MACD lack confirmation.
✴️ Conclusion: The trend is weak; consolidation dominates. Breakouts require ADX above 20 for validation.
⊢
🜎 Strategic Insight - Technical Oracle:
∴ The structural configuration of the moving averages (Price < EMA9 < EMA21 < EMA50) defines a layered bearish stacking, emphasizing that control remains under sellers until the price successfully reclaims successive thresholds;
∴ The triple resistance crown ($98.14 / $98.22 / $98.50) represents the immediate fortress overhead. Until pierced, rallies remain corrective rather than structural;
∴ The Bollinger Band compression in combination with ADX = 13.22 reflects a regime of latent instability: volatility is contracted, energy is being stored, and the market is poised for a sharp directional move once equilibrium breaks;
∴ Mapping of levels:
∴ Trigger mechanics (Daily):
∴ Cross-asset implication (BTC/USD): A DXY trapped beneath $98.50 with ADX under 18 provides tactical relief for risk assets - (Bitcoin, equities). Conversely, a reclaim above $98.50 coupled with rising ADX would exert renewed pressure on Bitcoin and global risk sentiment.
✴️ Conclusion:
∴ The DXY is operating in a compression regime with light bearish bias, encased beneath the triple-layered resistance of $98.22 and $98.50;
∴ Until the index secures a daily close above $98.50 supported by a strengthening ADX, the prevailing outlook remains range-to-down, targeting $97.94 and potentially $96.82;
∴ Should the crown of resistance be pierced with confirmed directional strength, the Dollar Index would advance toward $98.80 / $99.63, transitioning the macro background toward “risk-off” and imposing significant headwinds on Bitcoin and correlated assets.
⊢
𓂀 Stoic-Structural Interpretation - DXY (1D, Aug 19, 2025):
∴ The Dollar Index remains imprisoned beneath its triple crown of resistance ($98.14 -> $98.22 -> $98.50). Each layer functions not as mere numbers, but as thresholds of control - the fortress where sellers guard the path forward;
∴ Momentum structures (RSI at $47.75, MACD compressed below zero, ADX at $13.22) whisper of weak conviction, a battlefield where neither camp advances decisively. Volatility compresses, energy coils. The silence of the bands is not peace; it is the breath before release.
∴ Supports lie at $97.94 and $96.82 - the fragile floor where weakness exposes the Index to further descent. Resistances culminate in the $99.63 upper band - the bastion to be conquered should strength return.
✴️ Philosophical Seal: Like the Stoic who tests virtue in adversity, the DXY now tests resolve in compression. Its stillness is deceptive - for beneath equilibrium, forces accumulate. The wise trader, like the Stoic, does not chase the noise of indecision; he prepares, unmoved, for the inevitable expansion.
⊢
✦ Structure - DXY (1D, Aug 19, 2025):
∴ Bearish Stacking Alignment: Price $98.035 resides below EMA9 $98.139, which is below EMA21 $98.221, both beneath EMA50 $98.477. The moving averages align in descending order, sealing short-, mid-, and intermediate-term control under sellers;
∴ Compression Regime: Bollinger Bands narrowed to $96.815 / $99.628, with midline at $98.221. Volatility is contracted, reflecting equilibrium. The silence before expansion governs this phase;
∴ Momentum Exhaustion: RSI at 47.75 and MACD line at −0.085 with signal −0.082 indicate weakening drive, locked in indecision. ADX 13.22 confirms absence of a dominant directional force.
∴ Critical Thresholds:
• Support: $97.94 -> $96.82;
• Resistance: $98.22 -> $98.45–$98.50 -> $99.63;
These levels form the sacred geometry of the Dollar’s battlefield.
✴️ Structural Seal: The DXY is architected in a descending yet compressed formation - a fortress of resistance above, fragile floors below. Until ADX rises and one side seizes momentum, the Index drifts in suspended balance, storing potential for decisive rupture.
⊢
· Cryptorvm Dominvs · MAGISTER ARCANVM · Vox Primordialis ·
· Dominivm Cardo Gyratio Omnivm · Silence precedes the next force. Structure is sacred ·
⊢
⟁ DXY / U.S. Dollar Currency Index - TVC - (CHART: 1D) - (Aug 19, 2025).
◇ Analysis Price: 98.035.
⊣
⨀ I. Temporal Axis - Strategic Interval - (1D):
✴️Note: The DXY (TVC) does not provide native volume data; therefore, flow-based indicators (OBV, MFI) are substituted by ADX (14) to quantify trend strength.
▦ EMA9 - $98.139:
∴ The current price ($98.035) is positioned below the EMA9 - ($98.139), affirming short-term pressure from sellers;
∴ The slope of the EMA9 is flat to slightly downward, indicating the loss of bullish traction in the most immediate timeframe;
∴ The EMA9 is located beneath both the EMA21 and the EMA50, confirming the presence of a “bearish stacking” alignment.
✴️ Conclusion: The micro-trend remains subdued under short-term resistance. The immediate ceiling is defined at ~98.14, and failure to close above reinforces continuous seller control.
⊢
▦ EMA21 - $98.221:
∴ The price remains below the EMA21, which represents tactical control by sellers in the intermediate horizon;
∴ The fact that EMA9 < EMA21 demonstrates that rebound attempts will likely fail beneath 98.22;
∴ The EMA21 is in direct confluence with the Bollinger Band midline, magnifying the importance of 98.22 as a structural pivot.
✴️ Conclusion: The 98.22 zone is the primary tactical battleground; daily closure above would reduce immediate bearish pressure and open short-term relief potential.
⊢
▦ EMA50 - $98.477:
∴ The price resides below EMA50, and EMA21 is positioned below EMA50, both confirming the persistence of a downward-leaning intermediate trend;
∴ The EMA50 itself is sloping gently downward, acting as a supply zone between $98.45 / $98.50;
∴ Rejections have occurred repeatedly below the $98.5 region, validating this level as the medium-term structural ceiling.
✴️ Conclusion: The $98.45 / $98.50 range is the second barrier; only a sustained close above this threshold neutralizes the existing bearish framework.
⊢
▦ BB (21, 2) - $96.815 / $98.221 / $99.628:
∴ Current price oscillates around the midline ($98.22) but is positioned slightly below, keeping price action inside the lower quadrant of the bands;
∴ Bandwidth is approximately 2.81 points (~2.9% of the midline), which signals suppressed volatility and relative compression;
∴ The upper band at $99.63 and the lower band at $96.82 establish the immediate operational box.
✴️ Conclusion: A compression regime dominates; the probability of false breakouts increases as long as ADX remains below threshold levels.
⊢
▦ RSI (21, 9) - RSI 47.75 / Signal 48.17:
∴ The RSI remains below the neutral 50 line, maintaining a neutral-to-bearish bias;
∴ RSI is positioned beneath its signal line, reinforcing waning momentum;
∴ No oversold or overbought extremes are present, leaving ample room for mean-reversion moves in either direction;
∴ The RSI lost its bullish inclination after the early-August peak, revealing that bullish momentum has dissipated.
✴️ Conclusion: Relative strength is fragile and biased downward; pressure persists, though without signs of exhaustion.
⊢
▦ MACD (9, 21, 9) - MACD Line: −0.085 | Signal: −0.082 | Spread ≈ −0.003:
∴ Both MACD line and Signal line remain below zero, sustaining the negative macro momentum regime;
∴ The spread between MACD and Signal line is marginally negative (−0.003), illustrating momentum compression and indecision;
∴ The histogram bars are shallow, suggesting the likelihood of sideways “chop” until a decisive expansion occurs;
∴ No evidence yet of either bullish or bearish acceleration; instead, momentum is locked in equilibrium.
✴️ Conclusion: Residual bearish momentum persists, but without traction. A valid directional impulse requires expansion of the spread.
⊢
▦ ADX (14) - 13.22:
∴ ADX at 13.22 is significantly below the 20 threshold, confirming a non-trending market;
∴ Under low volatility and low ADX conditions, breakouts tend to fail or reverse, producing whipsaw environments;
∴ Without ADX expansion, directional signals from EMAs, RSI, or MACD lack confirmation.
✴️ Conclusion: The trend is weak; consolidation dominates. Breakouts require ADX above 20 for validation.
⊢
🜎 Strategic Insight - Technical Oracle:
∴ The structural configuration of the moving averages (Price < EMA9 < EMA21 < EMA50) defines a layered bearish stacking, emphasizing that control remains under sellers until the price successfully reclaims successive thresholds;
∴ The triple resistance crown ($98.14 / $98.22 / $98.50) represents the immediate fortress overhead. Until pierced, rallies remain corrective rather than structural;
∴ The Bollinger Band compression in combination with ADX = 13.22 reflects a regime of latent instability: volatility is contracted, energy is being stored, and the market is poised for a sharp directional move once equilibrium breaks;
∴ Mapping of levels:
- Support zones: $97.94 (recent intraday floor) -> $96.82 (lower Bollinger band);
- Resistance zones: $98.22 (BB midline + EMA21 pivot) -> $98.45 / $98.50 (EMA50 zone) -> $99.63 (BB upper).
∴ Trigger mechanics (Daily):
- Bullish relief scenario: A daily close above $98.22 exposes a test of $98.45 / $98.50. A confirmed structural shift requires closure above $98.50 with simultaneous ADX rising above 20, projecting extension toward $98.80 -> $99.63;
- Bearish continuation scenario: A breakdown below $97.94 expands the downside toward $96.82. Acceleration requires concurrent Bollinger Band expansion + ADX increase, validating momentum.
∴ Cross-asset implication (BTC/USD): A DXY trapped beneath $98.50 with ADX under 18 provides tactical relief for risk assets - (Bitcoin, equities). Conversely, a reclaim above $98.50 coupled with rising ADX would exert renewed pressure on Bitcoin and global risk sentiment.
✴️ Conclusion:
∴ The DXY is operating in a compression regime with light bearish bias, encased beneath the triple-layered resistance of $98.22 and $98.50;
∴ Until the index secures a daily close above $98.50 supported by a strengthening ADX, the prevailing outlook remains range-to-down, targeting $97.94 and potentially $96.82;
∴ Should the crown of resistance be pierced with confirmed directional strength, the Dollar Index would advance toward $98.80 / $99.63, transitioning the macro background toward “risk-off” and imposing significant headwinds on Bitcoin and correlated assets.
⊢
𓂀 Stoic-Structural Interpretation - DXY (1D, Aug 19, 2025):
∴ The Dollar Index remains imprisoned beneath its triple crown of resistance ($98.14 -> $98.22 -> $98.50). Each layer functions not as mere numbers, but as thresholds of control - the fortress where sellers guard the path forward;
∴ Momentum structures (RSI at $47.75, MACD compressed below zero, ADX at $13.22) whisper of weak conviction, a battlefield where neither camp advances decisively. Volatility compresses, energy coils. The silence of the bands is not peace; it is the breath before release.
∴ Supports lie at $97.94 and $96.82 - the fragile floor where weakness exposes the Index to further descent. Resistances culminate in the $99.63 upper band - the bastion to be conquered should strength return.
✴️ Philosophical Seal: Like the Stoic who tests virtue in adversity, the DXY now tests resolve in compression. Its stillness is deceptive - for beneath equilibrium, forces accumulate. The wise trader, like the Stoic, does not chase the noise of indecision; he prepares, unmoved, for the inevitable expansion.
⊢
✦ Structure - DXY (1D, Aug 19, 2025):
∴ Bearish Stacking Alignment: Price $98.035 resides below EMA9 $98.139, which is below EMA21 $98.221, both beneath EMA50 $98.477. The moving averages align in descending order, sealing short-, mid-, and intermediate-term control under sellers;
∴ Compression Regime: Bollinger Bands narrowed to $96.815 / $99.628, with midline at $98.221. Volatility is contracted, reflecting equilibrium. The silence before expansion governs this phase;
∴ Momentum Exhaustion: RSI at 47.75 and MACD line at −0.085 with signal −0.082 indicate weakening drive, locked in indecision. ADX 13.22 confirms absence of a dominant directional force.
∴ Critical Thresholds:
• Support: $97.94 -> $96.82;
• Resistance: $98.22 -> $98.45–$98.50 -> $99.63;
These levels form the sacred geometry of the Dollar’s battlefield.
✴️ Structural Seal: The DXY is architected in a descending yet compressed formation - a fortress of resistance above, fragile floors below. Until ADX rises and one side seizes momentum, the Index drifts in suspended balance, storing potential for decisive rupture.
⊢
· Cryptorvm Dominvs · MAGISTER ARCANVM · Vox Primordialis ·
· Dominivm Cardo Gyratio Omnivm · Silence precedes the next force. Structure is sacred ·
⊢
✠
Ritvs Logicæ in Terræ Chaos;
Nihil Tumultvs. Nihil Vanitatis. Tantum Silentivm, Structvra et Exsecutio.
𓂀 Vbi Volatilitas Disciplinam Tangit - Ibi Sto.
⩘ Porta Solum Aperitur Stantibvs in Silentio.
✠
Ritvs Logicæ in Terræ Chaos;
Nihil Tumultvs. Nihil Vanitatis. Tantum Silentivm, Structvra et Exsecutio.
𓂀 Vbi Volatilitas Disciplinam Tangit - Ibi Sto.
⩘ Porta Solum Aperitur Stantibvs in Silentio.
✠
Related publications
Disclaimer
The information and publications are not meant to be, and do not constitute, financial, investment, trading, or other types of advice or recommendations supplied or endorsed by TradingView. Read more in the Terms of Use.
✠
Ritvs Logicæ in Terræ Chaos;
Nihil Tumultvs. Nihil Vanitatis. Tantum Silentivm, Structvra et Exsecutio.
𓂀 Vbi Volatilitas Disciplinam Tangit - Ibi Sto.
⩘ Porta Solum Aperitur Stantibvs in Silentio.
✠
Ritvs Logicæ in Terræ Chaos;
Nihil Tumultvs. Nihil Vanitatis. Tantum Silentivm, Structvra et Exsecutio.
𓂀 Vbi Volatilitas Disciplinam Tangit - Ibi Sto.
⩘ Porta Solum Aperitur Stantibvs in Silentio.
✠
Related publications
Disclaimer
The information and publications are not meant to be, and do not constitute, financial, investment, trading, or other types of advice or recommendations supplied or endorsed by TradingView. Read more in the Terms of Use.