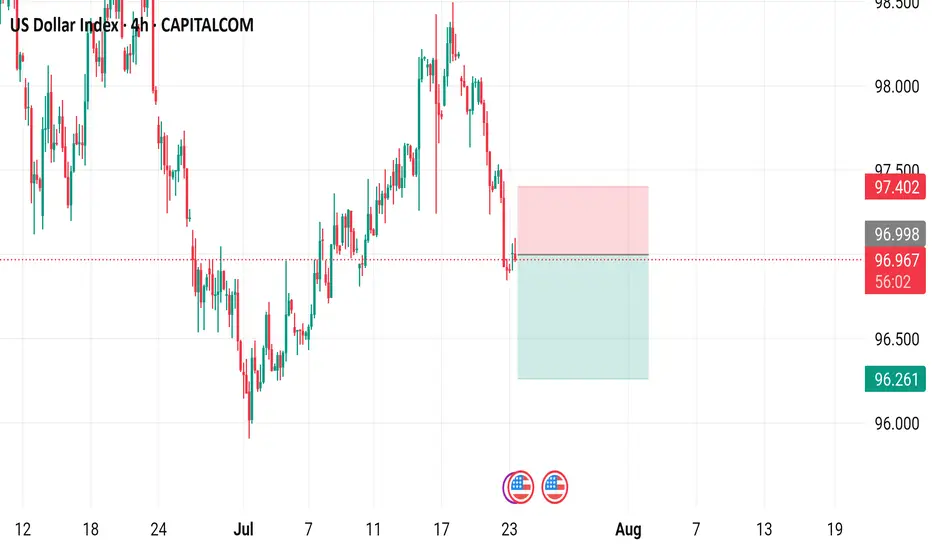
4-hour chart of the US Dollar Index (DXY) from CAPITALCOM shows the index's recent price movements. The current value is 96.955, with a slight increase of 0.054 (+0.06%). Key levels include a support at 96.413 and resistance at 97.554. The chart highlights buy signals at 97.012 and sell signals at 96.958 and 96.955, with a notable downward trend breaking below a support zone around 97.150.
Trade active
Hold your trades Guy's Daily XAU/USD FREE setups | Let's grow together!
| XAU/USD Trader | Telegram: https://t.me/Aleegoldsignals
| XAU/USD Trader | Telegram: https://t.me/Aleegoldsignals
Disclaimer
The information and publications are not meant to be, and do not constitute, financial, investment, trading, or other types of advice or recommendations supplied or endorsed by TradingView. Read more in the Terms of Use.
Daily XAU/USD FREE setups | Let's grow together!
| XAU/USD Trader | Telegram: https://t.me/Aleegoldsignals
| XAU/USD Trader | Telegram: https://t.me/Aleegoldsignals
Disclaimer
The information and publications are not meant to be, and do not constitute, financial, investment, trading, or other types of advice or recommendations supplied or endorsed by TradingView. Read more in the Terms of Use.