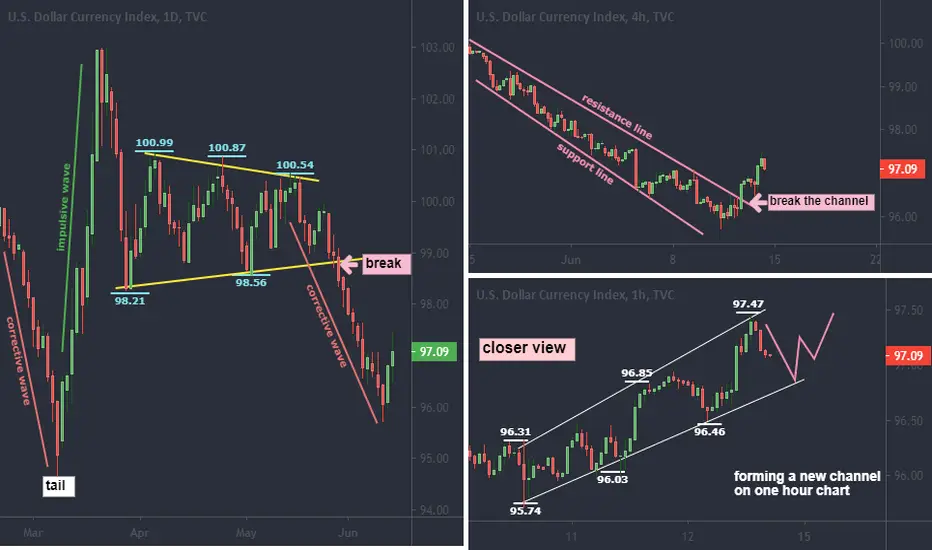
on one day chart it is clear to see that the price move is always big whether falling point or rising point.
Price has already taken its turn from long corrective wave.
on 4 hour chart following a parallel channel and breaks resistance line, in down direction
now coming on 1 hour chart
the price movement is very slow and a bullish channel is forming.
Price has already taken its turn from long corrective wave.
on 4 hour chart following a parallel channel and breaks resistance line, in down direction
now coming on 1 hour chart
the price movement is very slow and a bullish channel is forming.
Disclaimer
The information and publications are not meant to be, and do not constitute, financial, investment, trading, or other types of advice or recommendations supplied or endorsed by TradingView. Read more in the Terms of Use.
Disclaimer
The information and publications are not meant to be, and do not constitute, financial, investment, trading, or other types of advice or recommendations supplied or endorsed by TradingView. Read more in the Terms of Use.