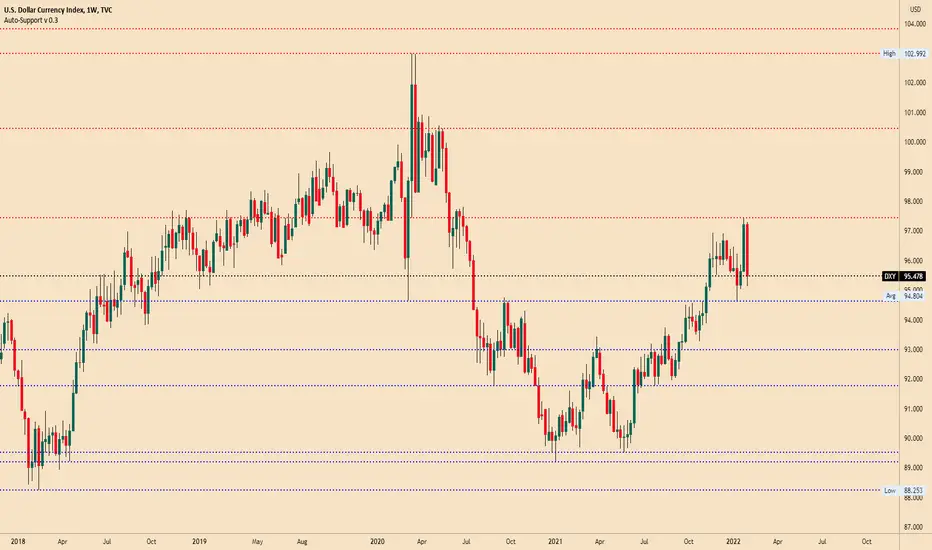
The weekly price chart below shows the U.S. Dollar Index printed a large bearish candlestick last week, establishing new lower resistance levels at 12215 and 12257 (the latter looking more reliable). This represents a bearish retracement following last week’s highest weekly close seen in 18 months. The price is also potentially supported by the support level at 12174.
If the support level at 12174 continues to hold, the long-term bullish trend will be likely to resume.
Overall, it seems clear we have a very bullish picture in the USD over the long and medium terms, so it will probably be wise to trade in the direction of long USD over the coming week, at least in the Forex market. In other markets, it is likely that the USD will not be a key driver of price movements.
Disclaimer
The information and publications are not meant to be, and do not constitute, financial, investment, trading, or other types of advice or recommendations supplied or endorsed by TradingView. Read more in the Terms of Use.
Disclaimer
The information and publications are not meant to be, and do not constitute, financial, investment, trading, or other types of advice or recommendations supplied or endorsed by TradingView. Read more in the Terms of Use.