hello friends
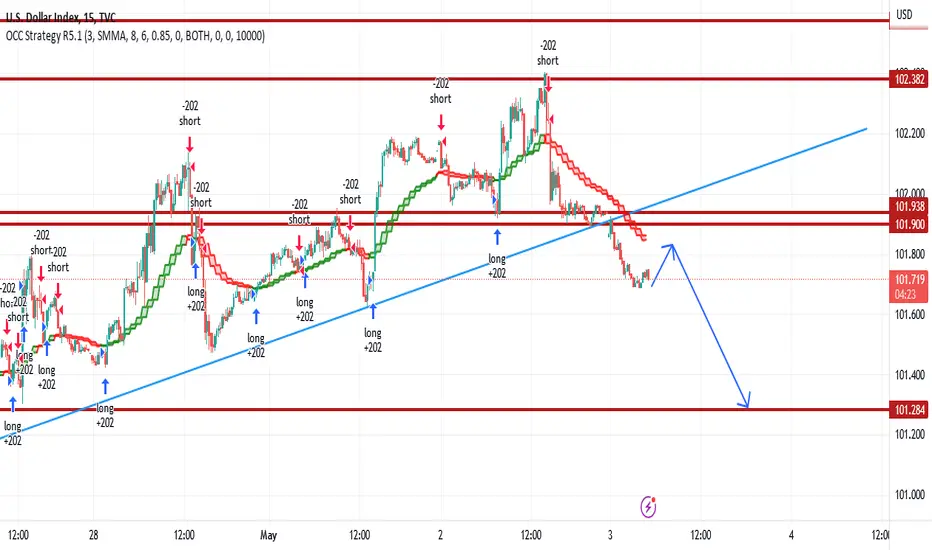
In the chart above, you can see the supports and resistances, and we can see that the price fluctuations are moving between these supports and resistances.
I think that in the 15-minute time frame, we have a pullback to lost support, and then a drop to the range of 101.284.
In the chart above, you can see the supports and resistances, and we can see that the price fluctuations are moving between these supports and resistances.
I think that in the 15-minute time frame, we have a pullback to lost support, and then a drop to the range of 101.284.
Trade closed: target reached
The intended target was seenDisclaimer
The information and publications are not meant to be, and do not constitute, financial, investment, trading, or other types of advice or recommendations supplied or endorsed by TradingView. Read more in the Terms of Use.
Disclaimer
The information and publications are not meant to be, and do not constitute, financial, investment, trading, or other types of advice or recommendations supplied or endorsed by TradingView. Read more in the Terms of Use.