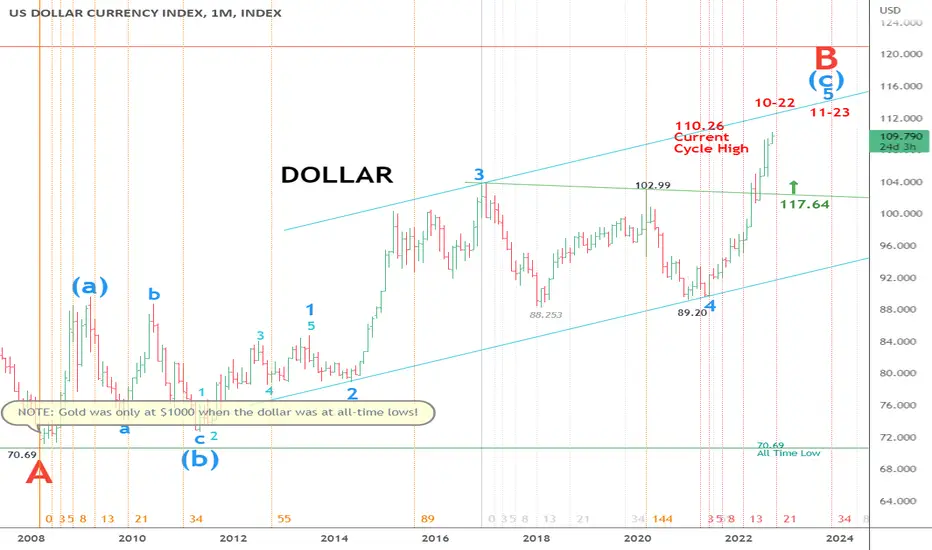
Since the historic print low of 70.69 in 2008, the US dollar has risen more than 55% to its current levels north of 110. There is no telling just how high the dollar can run amid the parabolic move upward from its 2021 low. An inverse head and shoulder pattern suggests a minimum upside price target of 117.64 or around 7% north of current levels. Fibonacci time cycles portend potential turning points this October and in November 2023. Despite all the headline inflation, the rise in the dollar is, by definition, deflationary. This suggests that given inflation remains steadily on the rise, the dollar needs to go significantly higher for its deflationary effects to manifest in the real economy. One item of particular note is the dollar-based price of gold today vs. at the dollar lows in 2008. At the all-time lows of 2008, Gold was trading in the $800-$1000 range. Contrast that to today, with a dollar that is 55% higher, and we see Gold trading at $1700. That says a lot about Gold's ability to hold its value amid a rising dollar, which is typically bearish for Gold.
Disclaimer
The information and publications are not meant to be, and do not constitute, financial, investment, trading, or other types of advice or recommendations supplied or endorsed by TradingView. Read more in the Terms of Use.
Disclaimer
The information and publications are not meant to be, and do not constitute, financial, investment, trading, or other types of advice or recommendations supplied or endorsed by TradingView. Read more in the Terms of Use.