DOLLAR INDEX MY VIEW-
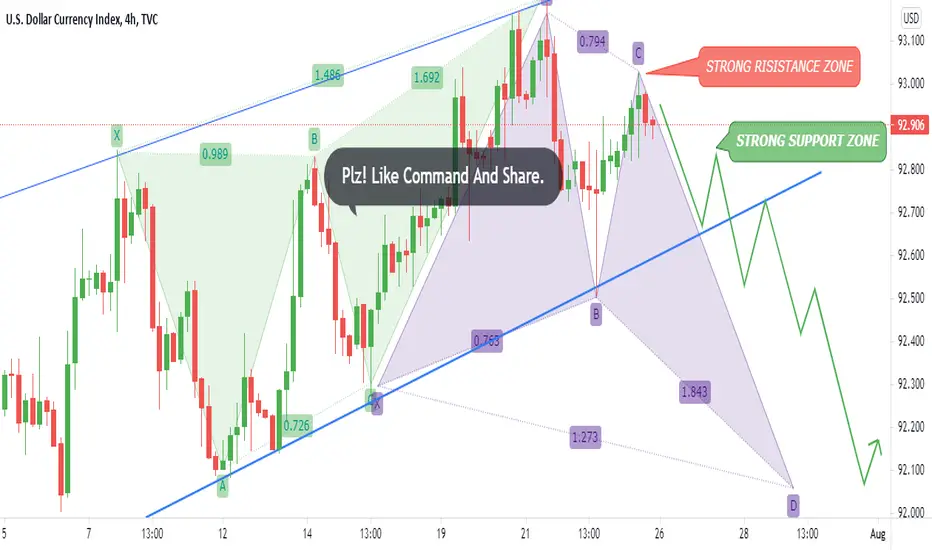
N.B- DXY chart long term create rising wedge pattern And short term chart
hopefully create butterfly pattern. When market Breakout 92.722 support zone
then market goes down to 92.540 & 92.145 support zone. If market breakout
93.050 Resistance zone. Then the market goes up to 93.200 & 93.500 zone.
AronnoFX will not accept any liability for loss or damage as a result of
reliance on the information contained within this channel including
data, quotes, charts and buy/sell signals
PLZ! LIKE COMMAND AND SHARE
Traders, if you like this idea or have your own opinion about it,
write in the comments. I will be glad
Disclaimer
The information and publications are not meant to be, and do not constitute, financial, investment, trading, or other types of advice or recommendations supplied or endorsed by TradingView. Read more in the Terms of Use.
Disclaimer
The information and publications are not meant to be, and do not constitute, financial, investment, trading, or other types of advice or recommendations supplied or endorsed by TradingView. Read more in the Terms of Use.