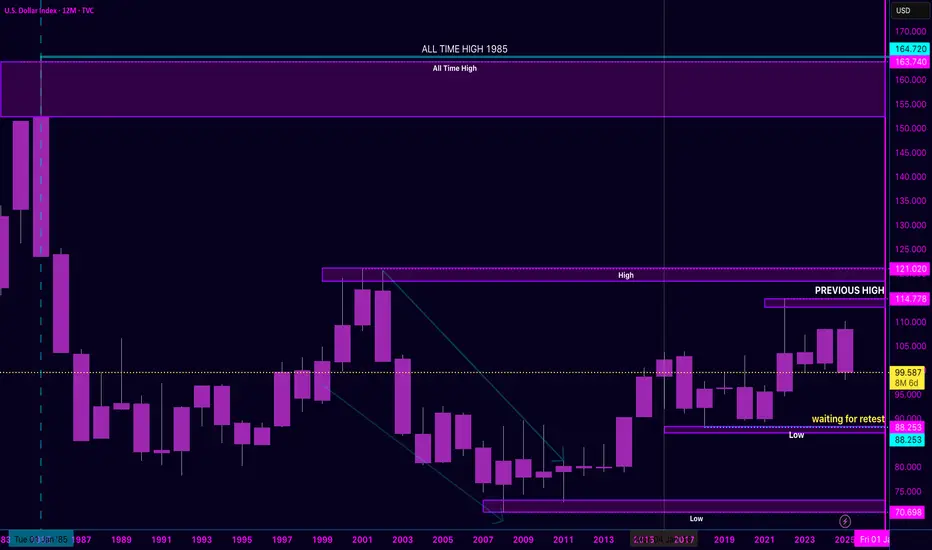
We’re currently trading at $99.58 — down 8.2% from the recent high around $114.77. Looking at this 12M chart, we see DXY failing to hold its breakout above the previous cycle highs.
🟣 Key Historical Levels:
Last major high: 1985 peak
Previous structure high: $121.18
Long-term support zones: $88.25, $75, and $72.81
🔻 Macro view suggests we could be entering another multi-year corrective phase if momentum doesn’t reclaim previous highs.
What’s next? Will the dollar revisit deeper support — or surprise us with a reclaim and breakout?
👁 Stay alert. This chart isn’t just about the USD — it impacts commodities, equities, emerging markets, and crypto.
#DXY #USDollar #MacroTrading #LongTermOutlook #DollarIndex #TechnicalAnalysis #SmartMoneyMoves #RecessionWatch
Disclaimer
The information and publications are not meant to be, and do not constitute, financial, investment, trading, or other types of advice or recommendations supplied or endorsed by TradingView. Read more in the Terms of Use.
Disclaimer
The information and publications are not meant to be, and do not constitute, financial, investment, trading, or other types of advice or recommendations supplied or endorsed by TradingView. Read more in the Terms of Use.