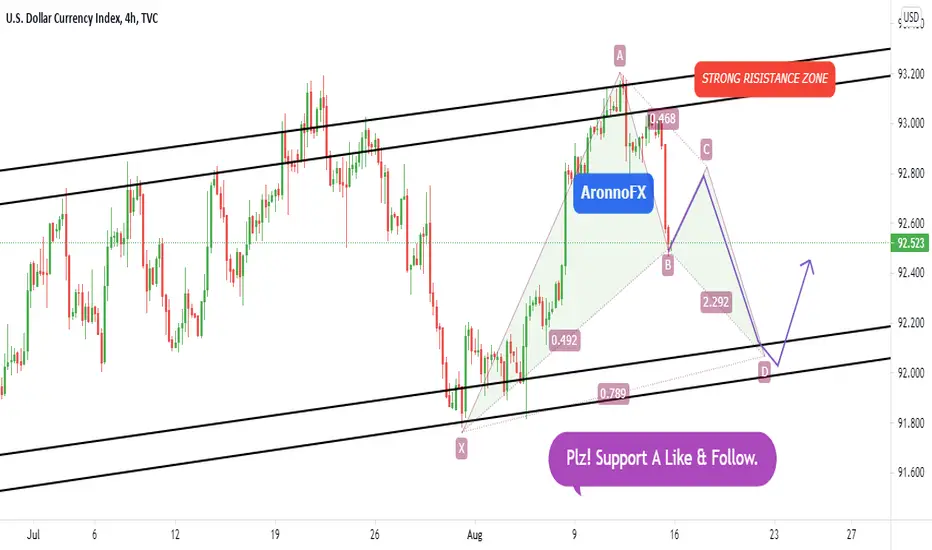
DXY chart long term create Double bottom pattern And short term chart
hopefully create butterfly pattern. Then the market goes Up to 92.730 & 92.922
resistance zone. Then, the market goes down to 92.111 support zone. If breakout
93.300 resistance zone then market goes to buy to 94.000.
Disclaimer
The information and publications are not meant to be, and do not constitute, financial, investment, trading, or other types of advice or recommendations supplied or endorsed by TradingView. Read more in the Terms of Use.
Disclaimer
The information and publications are not meant to be, and do not constitute, financial, investment, trading, or other types of advice or recommendations supplied or endorsed by TradingView. Read more in the Terms of Use.