The herd is completely bearish on the dxy, but the chart is showing something else.
The herd is an amazing indicator
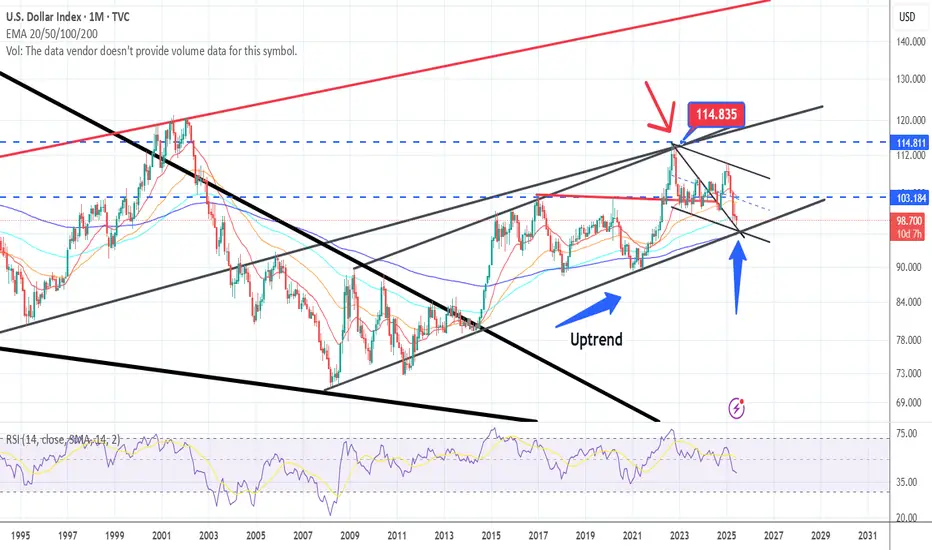
What do we see:
-Still in an uptrend
-the 200 ema (blue line)
-A resistance trendline becoming a support trendline?
-A bull flag, so the under part of the flag
So crossing of those 3 trendlines and the 200 ema is telling me that probably this chart is bullish.
The herd is an amazing indicator
What do we see:
-Still in an uptrend
-the 200 ema (blue line)
-A resistance trendline becoming a support trendline?
-A bull flag, so the under part of the flag
So crossing of those 3 trendlines and the 200 ema is telling me that probably this chart is bullish.
Disclaimer
The information and publications are not meant to be, and do not constitute, financial, investment, trading, or other types of advice or recommendations supplied or endorsed by TradingView. Read more in the Terms of Use.
Disclaimer
The information and publications are not meant to be, and do not constitute, financial, investment, trading, or other types of advice or recommendations supplied or endorsed by TradingView. Read more in the Terms of Use.