Bollinger Bands :
Candlestick Pattern :
Potential Scenarios :
Conclusion :
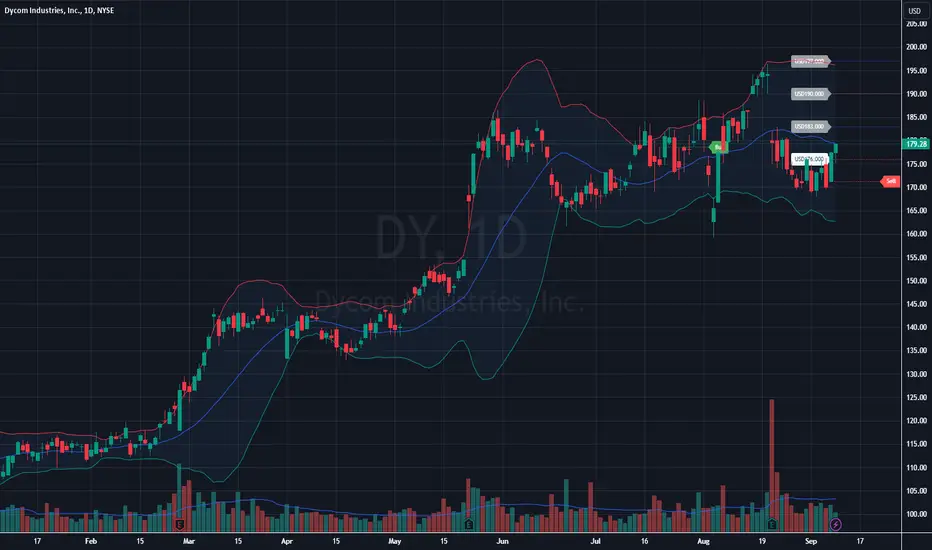
- Middle Line (SMA): The price is slightly above the middle line, which indicates that the stock is maintaining a neutral or mildly bullish stance, with potential support around this level.
Candlestick Pattern :
- Price Action: After a recent pullback, the stock appears to be attempting a recovery, closing near the upper end of the current range.
Potential Scenarios :
- Bullish: If the price closes above the middle Bollinger Band (SMA) with increased volume, it could be a sign of strength, with the potential to retest the upper band (around $196).
- Bearish: If the price moves below the middle band and breaches the lower Bollinger Band, it may signal further downside, especially if accompanied by higher volume.
Conclusion :
- Near-term trend: The stock is in a consolidation phase after a strong uptrend. The sideways movement indicates indecision, with potential for either a breakout or further correction depending on external factors like market sentiment and earnings data.
➀➁➂➃➄
Disclaimer
The information and publications are not meant to be, and do not constitute, financial, investment, trading, or other types of advice or recommendations supplied or endorsed by TradingView. Read more in the Terms of Use.
➀➁➂➃➄
Disclaimer
The information and publications are not meant to be, and do not constitute, financial, investment, trading, or other types of advice or recommendations supplied or endorsed by TradingView. Read more in the Terms of Use.