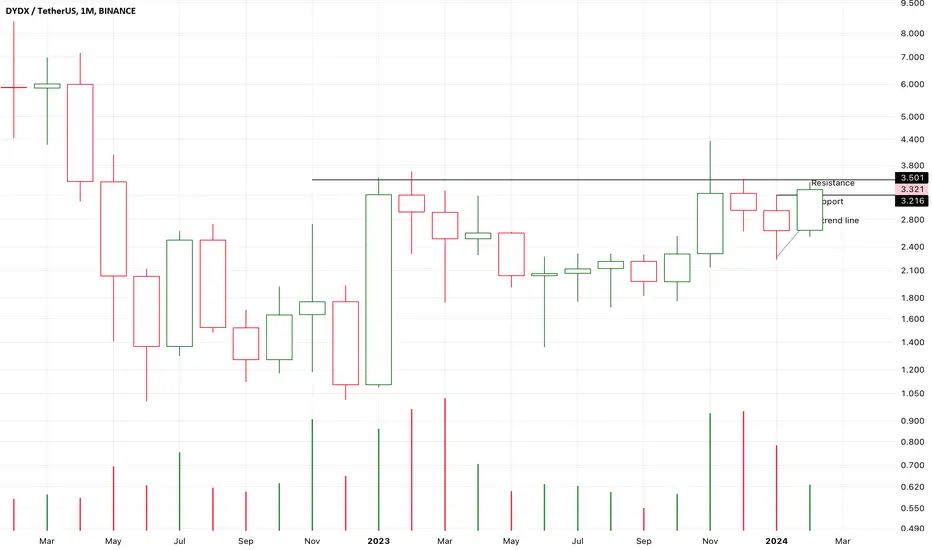
In month chart,
It is a potential bullish triangle pattern,
It seems that the candles is breaking up the upper limit of the pattern.
At the same time, the DYDX/BTC is also at the bottom.
So, I bought it today.
In day time chart,
K0 is fake down action,
And then K1 break up.
The small scale double top pattern was reversed immediately.
K0 to K1 is a bullish morning star pattern.
The strong momentum must be verified by the following candles.
If K2 keep pricing up to close upon the resistance,
The uptrend will be established.
Or else, the risk will increase.
Note
In day time chart,
K4 verified a potential resistance here.
The bullish momentum had turned to be more neutral.
Perhaps the following candles will consolidate here for days.
On the other hand,
K3 and K4 are bullish spring candles,
They test and sand upon the support.
If the following candles couldn’t close upon the resistance,
The risk will increase.
I had bought at K2,
If there are not strong bearish signals,
I will not leave the market temporarily.
Disclaimer
The information and publications are not meant to be, and do not constitute, financial, investment, trading, or other types of advice or recommendations supplied or endorsed by TradingView. Read more in the Terms of Use.
Disclaimer
The information and publications are not meant to be, and do not constitute, financial, investment, trading, or other types of advice or recommendations supplied or endorsed by TradingView. Read more in the Terms of Use.