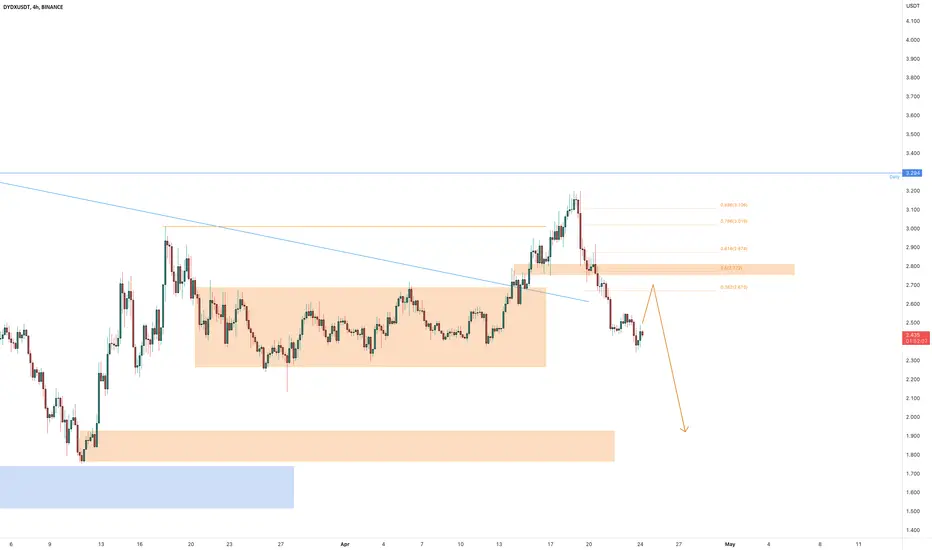
DYDXUSDT is testing the previous accumulation phase after a false breakout from the 3.3$ area where the price has daily resistance. This false breakout indicates that there was not enough buying pressure to sustain the price above the 3.3$ level, leading to a potential price reversal.
As per technical analysis, we could see a pullback around the 0.382 Fibonacci level before a potential new short position. This pullback may occur as sellers take profits, leading to a decrease in selling pressure and a potential price increase. However, once the pullback is completed, new short positions may be considered until the 1.9$ area where the price has the demand zone.
The demand zone at the 1.9$ area is characterized by a large number of buyers who are willing to purchase DYDX tokens at this price level. This demand zone is likely to have formed due to a previous period of accumulation where buyers were actively accumulating DYDX tokens, leading to a price increase.
According to Plancton's rules, new short positions may be considered once the price breaks below the 2.9$ support level, indicating a potential trend reversal.
–––––
Follow the Shrimp 🦐
Keep in mind.
- 🟣 Purple structure -> Monthly structure.
- 🔴 Red structure -> Weekly structure.
- 🔵 Blue structure -> Daily structure.
- 🟡 Yellow structure -> 4h structure.
- ⚫️ Black structure -> <= 1h structure.
Note
The price is testing the 0.382 Fibonacci level Note
Smashed 23%Note
still melting27%
Disclaimer
The information and publications are not meant to be, and do not constitute, financial, investment, trading, or other types of advice or recommendations supplied or endorsed by TradingView. Read more in the Terms of Use.
Disclaimer
The information and publications are not meant to be, and do not constitute, financial, investment, trading, or other types of advice or recommendations supplied or endorsed by TradingView. Read more in the Terms of Use.