Weekly Chart


 DYDXUSDT is moving up to resistance zone around 2.4 and this is third time try to break resistance.
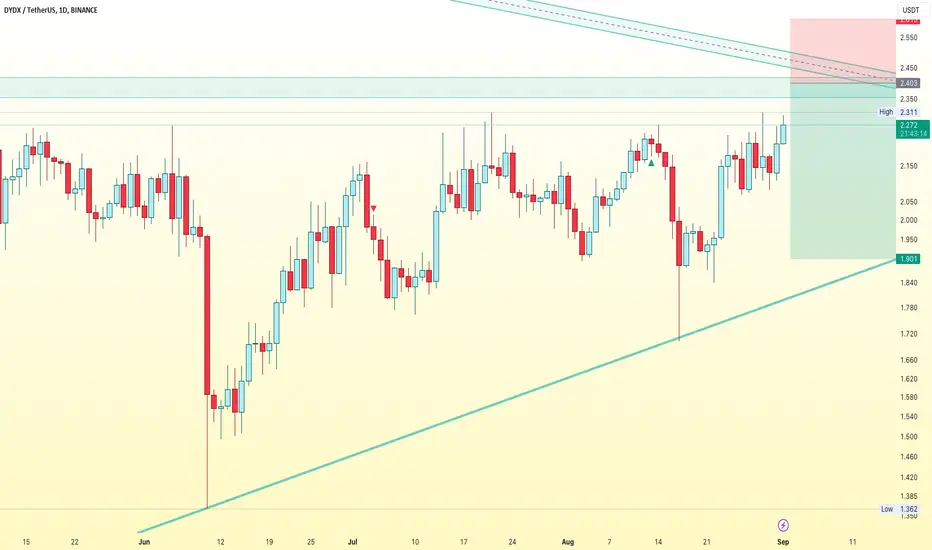
Daily Chart

DYDX is trying to test resistance at 2.3 if it's achieved, it will confront the strong resistance at 2.4 that is big challenge
Time will tell
Daily Chart
DYDX is trying to test resistance at 2.3 if it's achieved, it will confront the strong resistance at 2.4 that is big challenge
Time will tell
📱Copy Trade on BingX: bit.ly/48OD3GI
📱Copy Trade on Binance: bit.ly/3NHOTKQ
🔐 Buy Cold Wallet Ledger bit.ly/3OmOrBe
💬 Tele: t.me/trieutv_official
📱Copy Trade on Binance: bit.ly/3NHOTKQ
🔐 Buy Cold Wallet Ledger bit.ly/3OmOrBe
💬 Tele: t.me/trieutv_official
Related publications
Disclaimer
The information and publications are not meant to be, and do not constitute, financial, investment, trading, or other types of advice or recommendations supplied or endorsed by TradingView. Read more in the Terms of Use.