Hello Crypto Lovers,
Mars Signals team wishes you high profits.
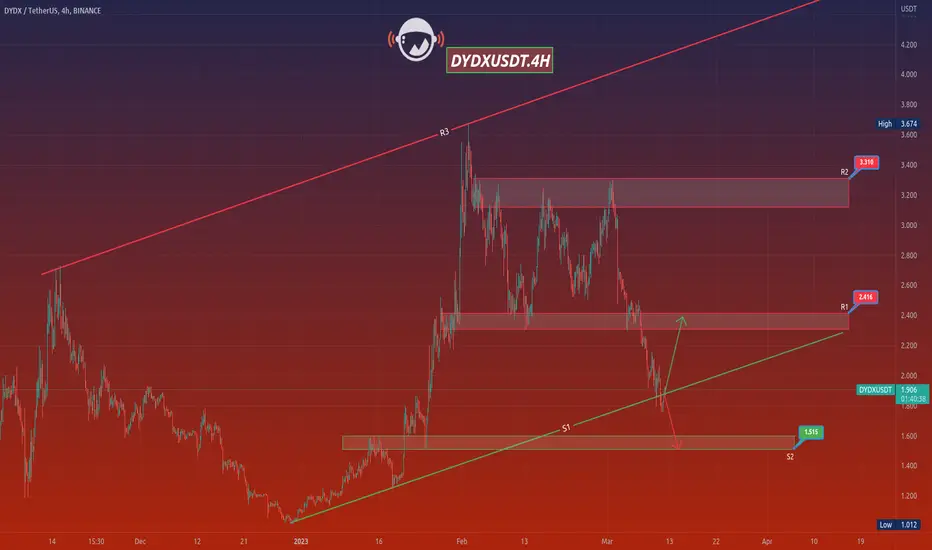
This is a 4-hour-time frame analysis for DYDXUSDT
In the current chart, R1, R2, and R3 are the resistance areas which contain the unsuccessful attempts of the price to rise. S2 used to be a long-term resistance area. And S1 is our long-term support line at the bottom expressing the well support of price at several points. Thus, the price was rejected at R1 and after a decline, it moved below S1. We see its fluctuation at this line in a rising behavior. So the price would have two choices for us. By providing us some confirmation candles for a rise, there is a possibility of an increase up to R1 and even higher than that via more fluctuation and fixation over there. Also you should know that in case the price loses the support at any points and falls below S1 line, surely more decline happens to it down to S2. We highly recommend you to obtain every piece of information and idea through our analyses for receiving more profitable trades.
Warning: This is just a suggestion and we do not guarantee profits. We advise you to analyze the chart before opening any positions.
Wish you luck
Mars Signals team wishes you high profits.
This is a 4-hour-time frame analysis for DYDXUSDT
In the current chart, R1, R2, and R3 are the resistance areas which contain the unsuccessful attempts of the price to rise. S2 used to be a long-term resistance area. And S1 is our long-term support line at the bottom expressing the well support of price at several points. Thus, the price was rejected at R1 and after a decline, it moved below S1. We see its fluctuation at this line in a rising behavior. So the price would have two choices for us. By providing us some confirmation candles for a rise, there is a possibility of an increase up to R1 and even higher than that via more fluctuation and fixation over there. Also you should know that in case the price loses the support at any points and falls below S1 line, surely more decline happens to it down to S2. We highly recommend you to obtain every piece of information and idea through our analyses for receiving more profitable trades.
Warning: This is just a suggestion and we do not guarantee profits. We advise you to analyze the chart before opening any positions.
Wish you luck
Disclaimer
The information and publications are not meant to be, and do not constitute, financial, investment, trading, or other types of advice or recommendations supplied or endorsed by TradingView. Read more in the Terms of Use.
Disclaimer
The information and publications are not meant to be, and do not constitute, financial, investment, trading, or other types of advice or recommendations supplied or endorsed by TradingView. Read more in the Terms of Use.