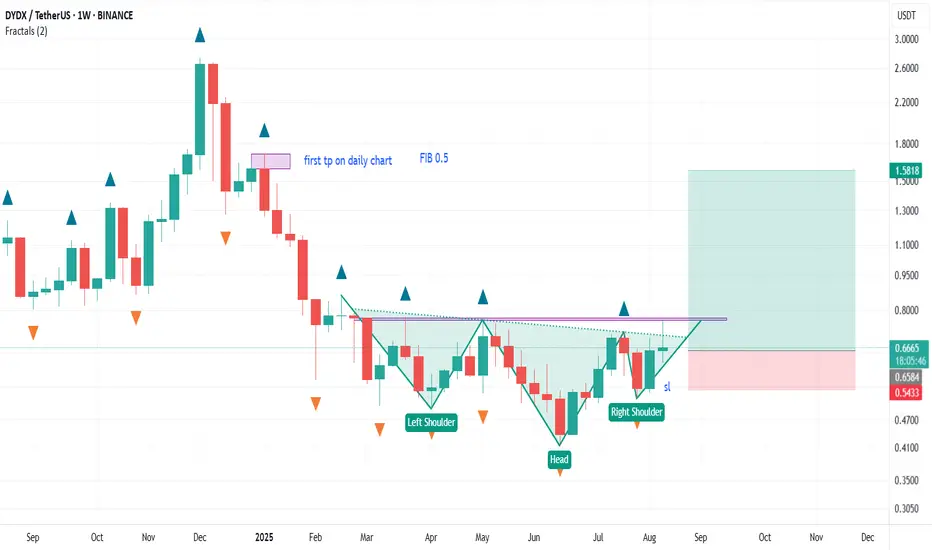
as we can see after a long term down trend the price has formed a head and shoulder pattern .
if price can break up the neck line on daily chart we will have the first signal.
SL on weekly chart and weekly strategy is 4 aug candle
TP : 6 JAN CANDLE which is the 0.5 fib ret
for accurate entrance daily or 4 hours chart should be controled
thank you
if price can break up the neck line on daily chart we will have the first signal.
SL on weekly chart and weekly strategy is 4 aug candle
TP : 6 JAN CANDLE which is the 0.5 fib ret
for accurate entrance daily or 4 hours chart should be controled
thank you
Disclaimer
The information and publications are not meant to be, and do not constitute, financial, investment, trading, or other types of advice or recommendations supplied or endorsed by TradingView. Read more in the Terms of Use.
Disclaimer
The information and publications are not meant to be, and do not constitute, financial, investment, trading, or other types of advice or recommendations supplied or endorsed by TradingView. Read more in the Terms of Use.