The RSI chart is moving in a bullish zone on the 4H TF.
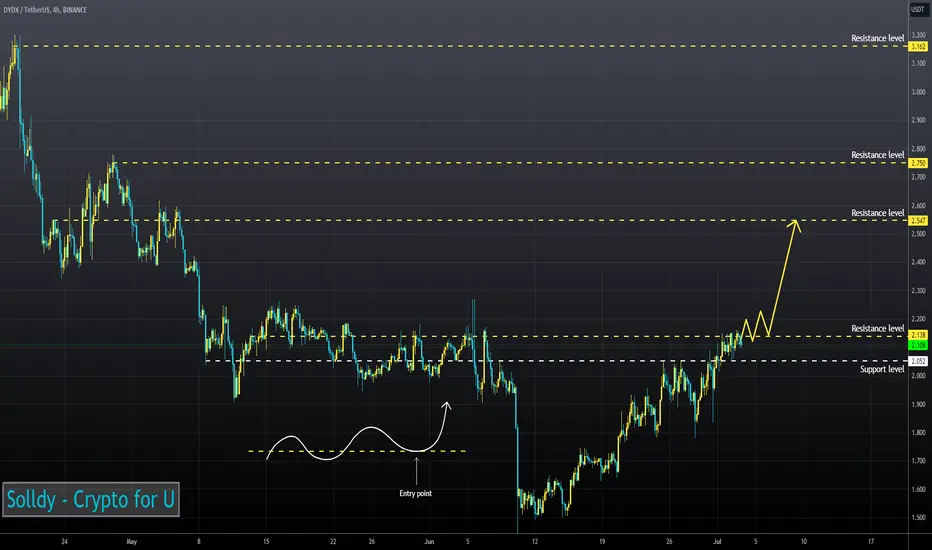
The DYDX is testing 50EMA as support on the 1H TF.
I believe the asset will continue to rise after fixing above the resistance level.
The DYDX is testing 50EMA as support on the 1H TF.
I believe the asset will continue to rise after fixing above the resistance level.
Disclaimer
The information and publications are not meant to be, and do not constitute, financial, investment, trading, or other types of advice or recommendations supplied or endorsed by TradingView. Read more in the Terms of Use.
Disclaimer
The information and publications are not meant to be, and do not constitute, financial, investment, trading, or other types of advice or recommendations supplied or endorsed by TradingView. Read more in the Terms of Use.