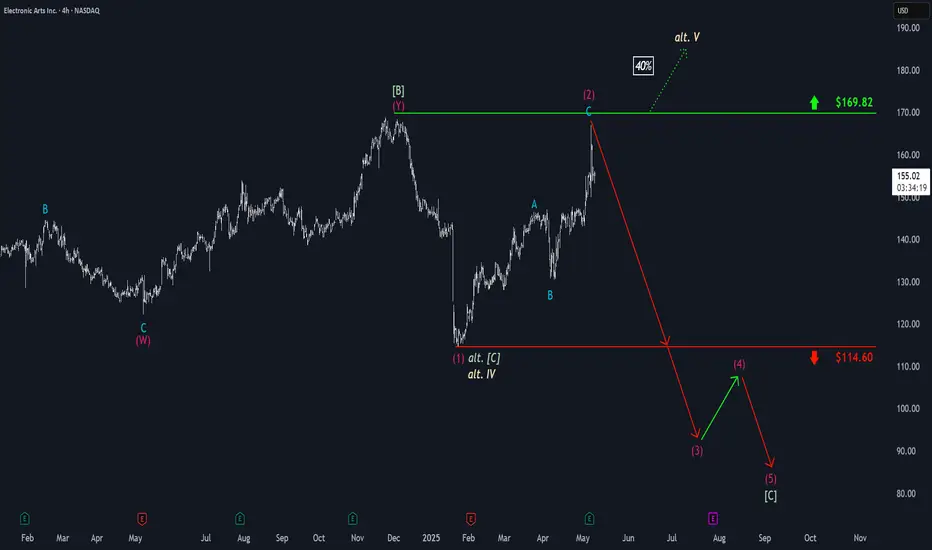
Recently, EA has made a strong upward jump, coming very close to the significant resistance at $169.82. However, the price quickly fell again, providing us with sufficient confirmation to consider the magenta wave (2) as completed. The current wave (3) should extend below the support at $114.60, and the subsequent wave (4) countermovement should also occur below this mark. With the final wave (5) of the magenta downtrend impulse, the larger green wave [C] should then be completed. On the other hand, we see a 40% chance that EA has already completed the green wave alt.[C] at $114.60 and will directly rise above the resistance at $169.82 during the beige wave alt. V.
📊 Free daily market insights combining macro + Elliott Wave analysis
🚀 Spot trends early with momentum, sentiment & price structure
🌐 Join thousands trading smarter - full free analyses at dailymarketupdate.com
🚀 Spot trends early with momentum, sentiment & price structure
🌐 Join thousands trading smarter - full free analyses at dailymarketupdate.com
Related publications
Disclaimer
The information and publications are not meant to be, and do not constitute, financial, investment, trading, or other types of advice or recommendations supplied or endorsed by TradingView. Read more in the Terms of Use.