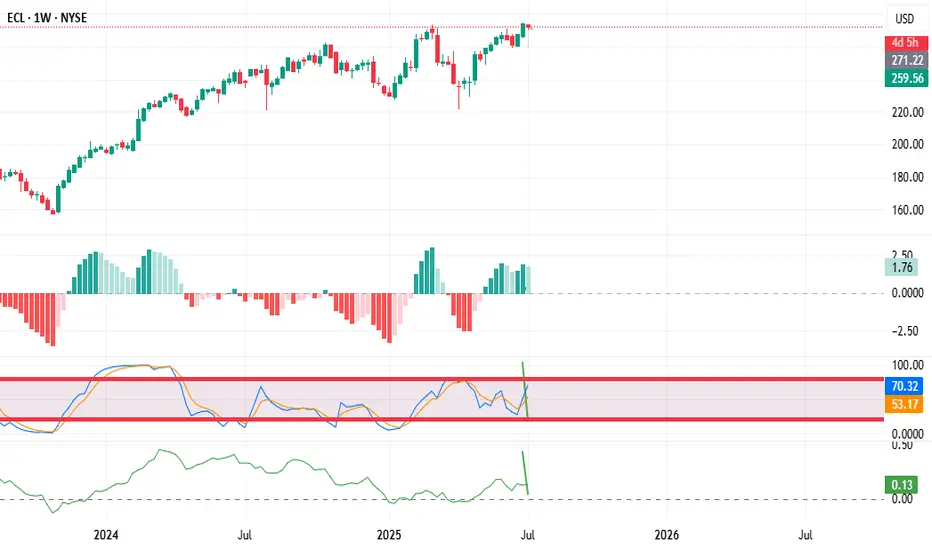
According to Mr. Elder's method, I start my analysis with the senior chart, for me it's the Weekly. I look through the list of stocks looking for stocks with a price divergence to the MACD indicator. This is my "first Elder screen"

After that, I switch to the daily chart and look at the selected stocks on this time frame. This is my "second Elder screen"

And I do the same procedure with the selected charts on the hourly chart

On the Hourly chart, I see a great divergence of the price to the indicators.
pending order under the candle marked with an arrow, stop above it, take profit about 1:5
After that, I switch to the daily chart and look at the selected stocks on this time frame. This is my "second Elder screen"
And I do the same procedure with the selected charts on the hourly chart
On the Hourly chart, I see a great divergence of the price to the indicators.
pending order under the candle marked with an arrow, stop above it, take profit about 1:5
Trade active
the price has activated a pending order.Disclaimer
The information and publications are not meant to be, and do not constitute, financial, investment, trading, or other types of advice or recommendations supplied or endorsed by TradingView. Read more in the Terms of Use.
Disclaimer
The information and publications are not meant to be, and do not constitute, financial, investment, trading, or other types of advice or recommendations supplied or endorsed by TradingView. Read more in the Terms of Use.