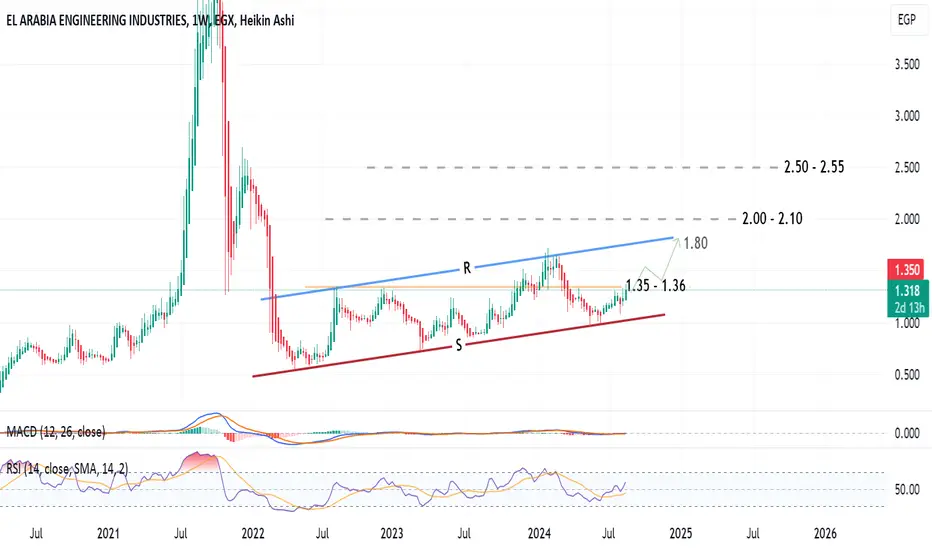
Weekly chart, the stock  EEII is supposed to continue trading in the rising channel and test the resistance line at around 1.80
Trading for 2 weeks above 1.80, the target will be 2.50 - 2.55 passing through a resistance zone at 2.00 - 2.10
Technical indicators MACD and RSI are supporting this positive view.
Note: Stop loss below 1.24, and to be raised along with the rising price.
Trading for 2 weeks above 1.80, the target will be 2.50 - 2.55 passing through a resistance zone at 2.00 - 2.10
Technical indicators MACD and RSI are supporting this positive view.
Note: Stop loss below 1.24, and to be raised along with the rising price.
Related publications
Disclaimer
The information and publications are not meant to be, and do not constitute, financial, investment, trading, or other types of advice or recommendations supplied or endorsed by TradingView. Read more in the Terms of Use.
Related publications
Disclaimer
The information and publications are not meant to be, and do not constitute, financial, investment, trading, or other types of advice or recommendations supplied or endorsed by TradingView. Read more in the Terms of Use.