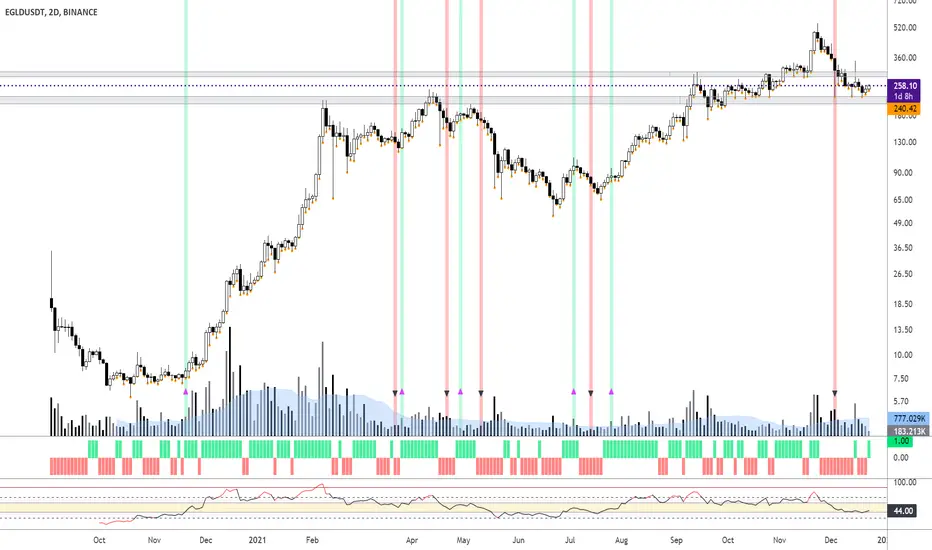
I was asked to chart EGLD /USDT. And how the Supertrend Ninja indicator performed on it since the listing.
Currently price is bouncing between support and resistance (2 grey blocks). Which makes/made EGLD ideal for a gridbot.
RSI is slowly moving towards 44, which means it is still in a range (displayed in the RSI as a yellow block). Right now as things stand it's not so interesting for trend traders. On the other hand volume is going down, which means a big move is likely to happen very soon. Before making any trades. I'll be waiting for confirmation from the Supertrend Ninja indicator showing some bullishness first. Ideally I would like to see some more green blocks on the Heikin Ashi indicator below as well.
In the chart I am using the Supertrend Ninja indicator, which is a trend-following indicator (Green and red vertical line with arrows).
When the background of the candlestick closes green with an upwards pointing pink arrow. It indicates a possible bullish (up)trend.
The Supertrend Ninja indicator gave only 4 bullish signals for the 2 day chart in 2021. And 1 bullish signal in 2020. Which in my opinion makes each bullish signal very reliable.
With each trade I make, proper risk management is essential. Either by using the Trailing Stoploss Bottom Activation indicator, visible as orange dots below the candles. Which sends an alert, when current price goes below the previous candle low. Or using the Heikin Ashi Trailing Stoploss Activation, the indicator below with green and red blocks. Remember, the first stop(loss) is always the cheapest stop.
Thank you for reading.
Namasté
Disclaimer: Ideas are for entertainment purposes only. Not financial advice. Your own due diligence is highly advised before entering trades.
Past performance is no guarantee of future returns.
Beware of scammers. I do NOT have Telegram, Discord, Instagram, Twitter, Youtube or Facebook.
Tradingview is the only channel I use.
Tradingview is the only channel I use.
Disclaimer
The information and publications are not meant to be, and do not constitute, financial, investment, trading, or other types of advice or recommendations supplied or endorsed by TradingView. Read more in the Terms of Use.