📊 EGLD/USDT – 4H Technical Analysis
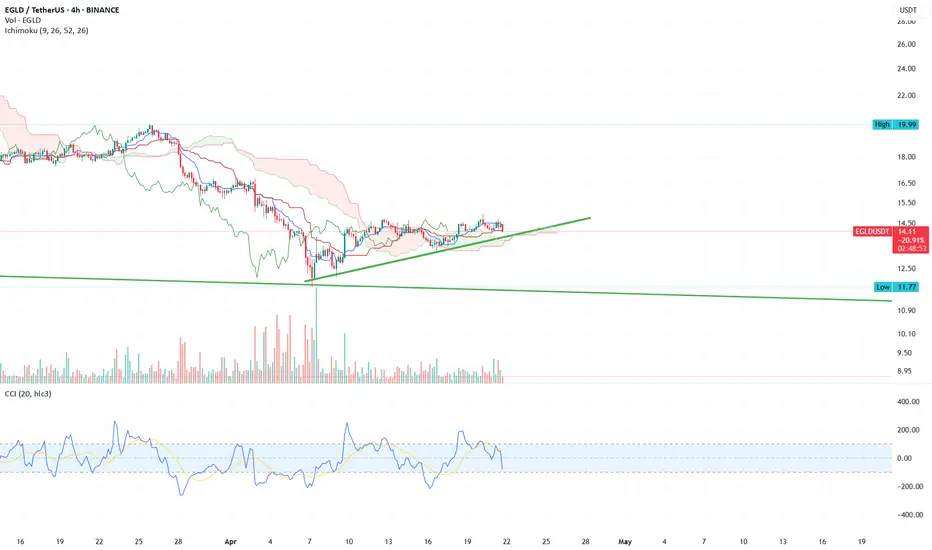
The price of EGLD/USDT is currently trading at $14.28, consolidating in a rising triangle pattern after a significant downtrend.
🔍 Key Observations:
Ascending trendline support is clearly holding since the April bottom, showing gradual higher lows.
Ichimoku Cloud indicates mixed signals:
Price is above the Kumo, suggesting short-term bullish momentum.
However, the cloud ahead is thin, indicating weak support/resistance levels and a potential for indecision.
CCI (Commodity Channel Index) is slightly negative around -6.91, indicating a lack of strong momentum and a possible pause or retracement.
Volume has decreased recently, showing that buyers are cautious and not yet confirming a breakout.
🧭 Key Levels:
Support: $13.44 (horizontal), $14.00 (trendline)
Resistance: ~$15.00 (local top), followed by $16.50 and $19.99 (historical high)
⚠️ Outlook:
A break above $15.00 with strong volume could confirm bullish continuation.
A break below the trendline (~$14.00) might trigger a deeper pullback toward the $13.00–$12.00 region.
Disclaimer
The information and publications are not meant to be, and do not constitute, financial, investment, trading, or other types of advice or recommendations supplied or endorsed by TradingView. Read more in the Terms of Use.
Disclaimer
The information and publications are not meant to be, and do not constitute, financial, investment, trading, or other types of advice or recommendations supplied or endorsed by TradingView. Read more in the Terms of Use.