📈💥 Greetings, traders and investors of TradingView! Let's dive into the analysis of elrond!
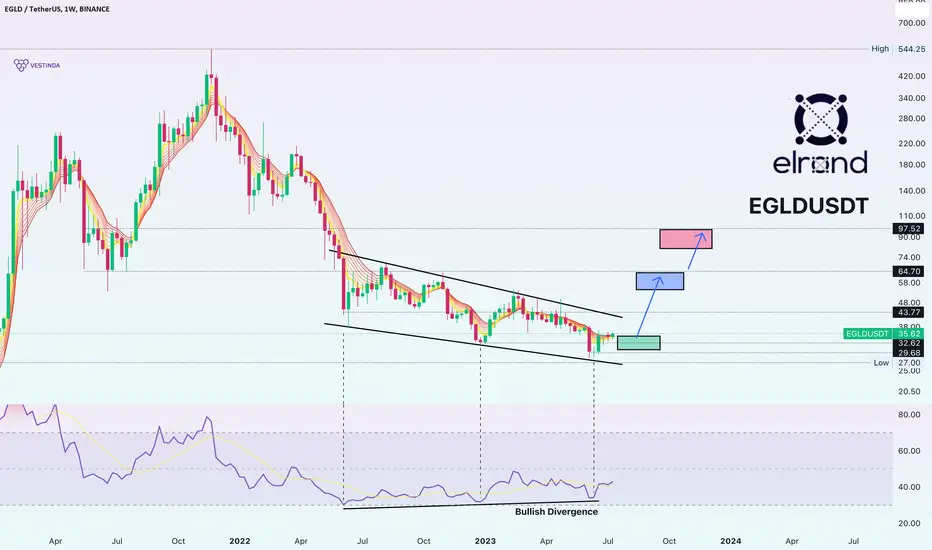
🚀 Today, EGLDUSDT finds itself in a relatively low position after experiencing a massive crash from its all-time high (ATH) at $544. The price has plummeted by nearly 95% to the $30-35 zone, where it currently resides.
🔍 When examining the weekly timeframe, we observe a bullish divergence on the RSI indicator. This suggests a potential upward movement for EGLDUSDT in the coming months, signaling a possible shift in market sentiment.
📊 It's important to consider previous support and resistance zones. Based on these levels, we can identify potential target zones for bullish momentum. The blue box on the chart indicates a target range of $54-64, while the red box represents a target range of $80-99. However, we believe that reaching the red box target has a lower probability, so take that into account when planning your trades.
💡 As always, it's crucial to stay updated on market developments, monitor price action, and employ proper risk management techniques. Set stop-loss orders and adjust your trading strategies accordingly.
🔍 Feel free to explore our resources to enhance your trading skills:
[url=tradingview.com/u/Vestinda/[EDUCATION] Education articles
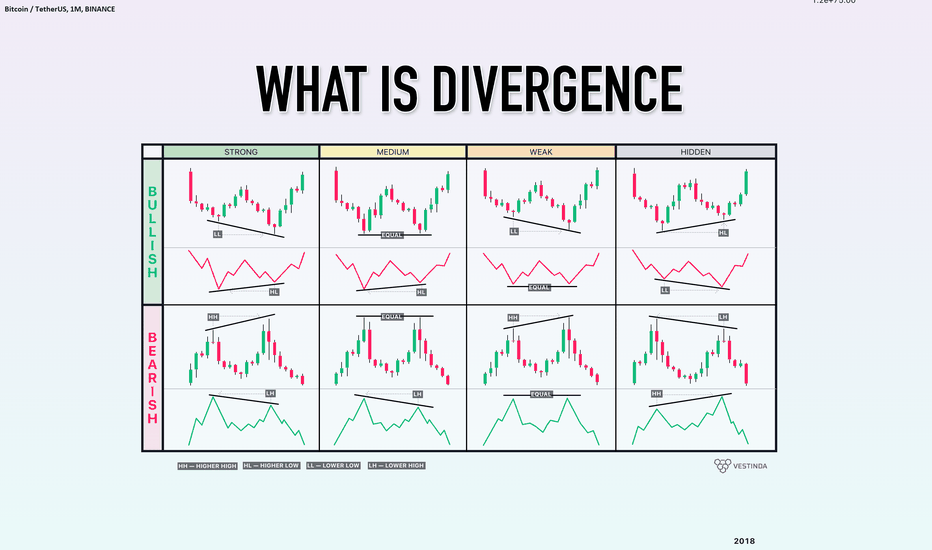
📚📈 Curious about Bullish Divergence? Dive into our comprehensive article for a deeper understanding of this powerful indicator and how it relates to EGLDUSDT's current situation! 🚀📈
Read the Article Here ➡️
Happy trading! 💰🚀
🚀 Today, EGLDUSDT finds itself in a relatively low position after experiencing a massive crash from its all-time high (ATH) at $544. The price has plummeted by nearly 95% to the $30-35 zone, where it currently resides.
🔍 When examining the weekly timeframe, we observe a bullish divergence on the RSI indicator. This suggests a potential upward movement for EGLDUSDT in the coming months, signaling a possible shift in market sentiment.
📊 It's important to consider previous support and resistance zones. Based on these levels, we can identify potential target zones for bullish momentum. The blue box on the chart indicates a target range of $54-64, while the red box represents a target range of $80-99. However, we believe that reaching the red box target has a lower probability, so take that into account when planning your trades.
💡 As always, it's crucial to stay updated on market developments, monitor price action, and employ proper risk management techniques. Set stop-loss orders and adjust your trading strategies accordingly.
🔍 Feel free to explore our resources to enhance your trading skills:
[url=tradingview.com/u/Vestinda/[EDUCATION] Education articles
📚📈 Curious about Bullish Divergence? Dive into our comprehensive article for a deeper understanding of this powerful indicator and how it relates to EGLDUSDT's current situation! 🚀📈
Read the Article Here ➡️
Happy trading! 💰🚀
💡 Elevate Your Trading Game! Join Vestinda's Vibrant Discord Community💬
📈 Discover insights, share strategies, and connect with fellow traders. Click to join: bit.ly/3rmVr9b 💜💜💜
📈 Discover insights, share strategies, and connect with fellow traders. Click to join: bit.ly/3rmVr9b 💜💜💜
Disclaimer
The information and publications are not meant to be, and do not constitute, financial, investment, trading, or other types of advice or recommendations supplied or endorsed by TradingView. Read more in the Terms of Use.