Summary
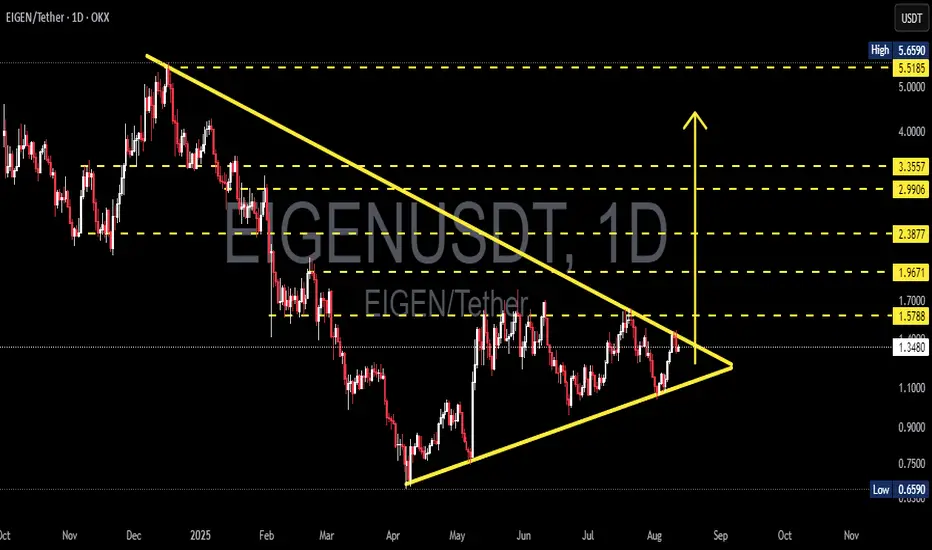
The daily chart shows a symmetrical triangle pattern (descending resistance from Dec–Aug and ascending support from April). Price is currently around 1.36 USDT, squeezing into the narrow apex zone — this suggests high volatility is likely once a breakout occurs. Statistically, this pattern is neutral, but the formation of higher lows since April gives a slight bullish bias. However, given the prior strong downtrend, we must not ignore the potential for a continuation to the downside.
---
Technical Pattern Details
Pattern: Symmetrical triangle / contracting triangle — two converging trendlines: lower highs vs higher lows.
Meaning: Consolidation between buyers & sellers, representing accumulation/distribution before a sharp move.
Probability: Neutral — the breakout direction defines the medium-term bias. With the prior downtrend, continuation is possible, but persistent higher lows suggest ongoing demand.
Timing: Apex likely reached in Sept; breakouts often occur before or at the apex.
---
Key Levels (from chart)
Current price: 1.3604 USDT
Resistance levels: 1.5788, 1.9671, 2.3877, 2.9906, 3.3557, and major high at 5.52–5.66 USDT.
Key support: ascending trendline & historical low at 0.6590 USDT.
---
Bullish Scenario (Confirmation & Targets)
Confirmation:
1. Daily candle closes above the triangle resistance (~1.58–1.65 USDT, depending on precision).
2. Breakout volume is higher than average.
3. Retest holds as support after breakout.
Targets after bullish breakout:
TP1: 1.5788
TP2: 1.9671
TP3: 2.3877 → 2.9906 → 3.3557 (if strong momentum)
Example aggressive setup:
Entry: 1.62 USDT
Stop-loss: 1.30 USDT
Risk per unit = 0.32 USDT
TP1 (1.97) → ~1.09R
TP2 (2.38) → ~2.37R
---
Bearish Scenario (Confirmation & Targets)
Confirmation:
1. Strong rejection at triangle resistance, followed by daily close below ascending support.
2. Increased volume on breakdown.
3. Failed retest of broken support.
Targets after bearish breakdown:
TP1: Local support zones (~1.10–0.90).
TP2: Historical low 0.6590 USDT.
Example short setup:
Entry: 1.30 USDT
Stop-loss: 1.60 USDT
Target: 0.659 USDT → ~2.14R
---
Trading & Risk Management Notes
1. Wait for confirmation — avoid early intraday breakouts.
2. Retest entries for conservative trades.
3. Stop-loss placement beyond structural levels.
4. Risk per trade: 1–3% of total capital.
5. Partial scale-in if breakout shows strong momentum.
6. Beware of fakeouts — common in tightening triangles.
---
Confirmation Checklist
Daily close outside trendline.
Breakout volume above accumulation average.
RSI/Stoch supports breakout direction.
Multi-timeframe alignment (e.g., 4H, 12H).
Liquidity/spread checks on exchange.
---
Risk Notes
Triangles after a downtrend can be continuation patterns — don’t pre-bias without confirmation.
Use horizontal resistance levels for realistic profit-taking instead of overly optimistic measured moves.
Watch for correlated market moves (BTC/ETH).
---
EIGEN/USDT (1D) forming a symmetrical triangle — volatility spike likely as breakout nears. Wait for daily close + volume above 1.58–1.65 for bullish targets (1.97 → 2.38 → 2.99), or breakdown below ascending support for bearish targets (down to 0.659). Manage risk and watch for retests.
#EIGEN #EIGENUSDT #CryptoTA #SymmetricalTriangle #BreakoutSetup #SupportResistance #TechnicalAnalysis #CryptoTrading #AltcoinAnalysis #RiskManagement
✅ Get Free Signals! Join Our Telegram Channel Here: t.me/TheCryptoNuclear
✅ Twitter: twitter.com/crypto_nuclear
✅ Join Bybit : partner.bybit.com/b/nuclearvip
✅ Benefits : Lifetime Trading Fee Discount -50%
✅ Twitter: twitter.com/crypto_nuclear
✅ Join Bybit : partner.bybit.com/b/nuclearvip
✅ Benefits : Lifetime Trading Fee Discount -50%
Disclaimer
The information and publications are not meant to be, and do not constitute, financial, investment, trading, or other types of advice or recommendations supplied or endorsed by TradingView. Read more in the Terms of Use.