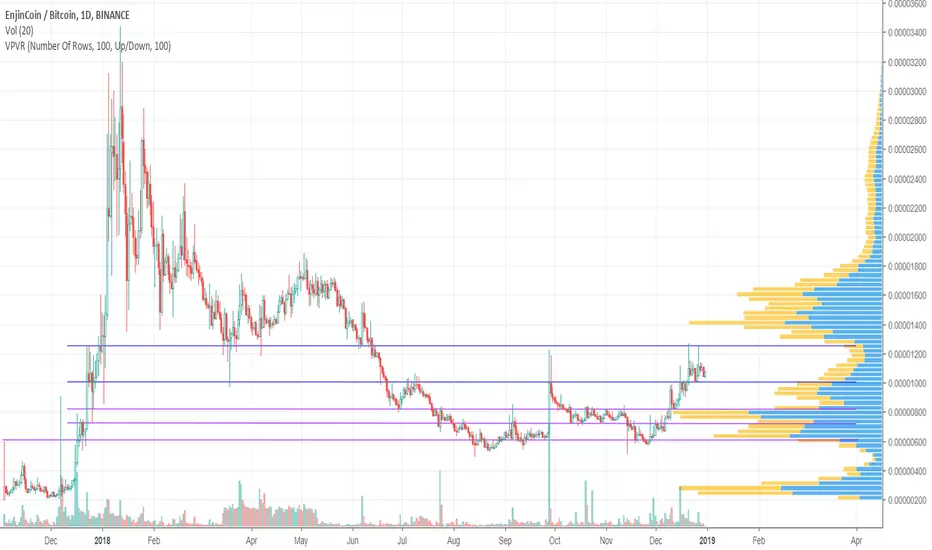
I only make charts about things I believe have a long term future; I'm not a day trader. Enjin is one of these things, therefore I decided to make a chart (daily) showing the support levels for buying opportunities.
The strongest support in terms of buying volume is the third line down, the buying volume is almost double the selling. This level has also previously been both support and resistance 11 times no less. The buying volume is dwindling day by day so hopefully should see a drop to one of these levels. But hey, this is just my plan, you buy when you want and this isn't advice del financial etc. etc.
The strongest support in terms of buying volume is the third line down, the buying volume is almost double the selling. This level has also previously been both support and resistance 11 times no less. The buying volume is dwindling day by day so hopefully should see a drop to one of these levels. But hey, this is just my plan, you buy when you want and this isn't advice del financial etc. etc.
Note
Zooming in on the daily, we can see it reached the first support zone and it rebounded off and went up again, BUT didn't make a higher high and has come back down to same support line so this is the 3rd bounce from this support line recently. A downward trend line has also been identified since it has touched same line 3 times, it hasn't broken it yet so maybe it will be time to go down to the next support level? Let's find out. Note
So far so good i.e. not buying and waiting. I have updated the chart by changing the S&R lines into S&R zones and have also added in diagonal S&R zones: Note
Nestled along this support line, but for how long? The RSI and MACD doesn't look positive.Note
ENJ fell off this level, wicked into the next and bounced up just as RSI oversold. Fair enough. Note
The support & resistance lines have worked well so far. Whicking down to that zone + RSI oversold was a good combination for a long term buy signal: Note
Note
Wonderful:Note
...which was niceNote
Disclaimer
The information and publications are not meant to be, and do not constitute, financial, investment, trading, or other types of advice or recommendations supplied or endorsed by TradingView. Read more in the Terms of Use.
Disclaimer
The information and publications are not meant to be, and do not constitute, financial, investment, trading, or other types of advice or recommendations supplied or endorsed by TradingView. Read more in the Terms of Use.