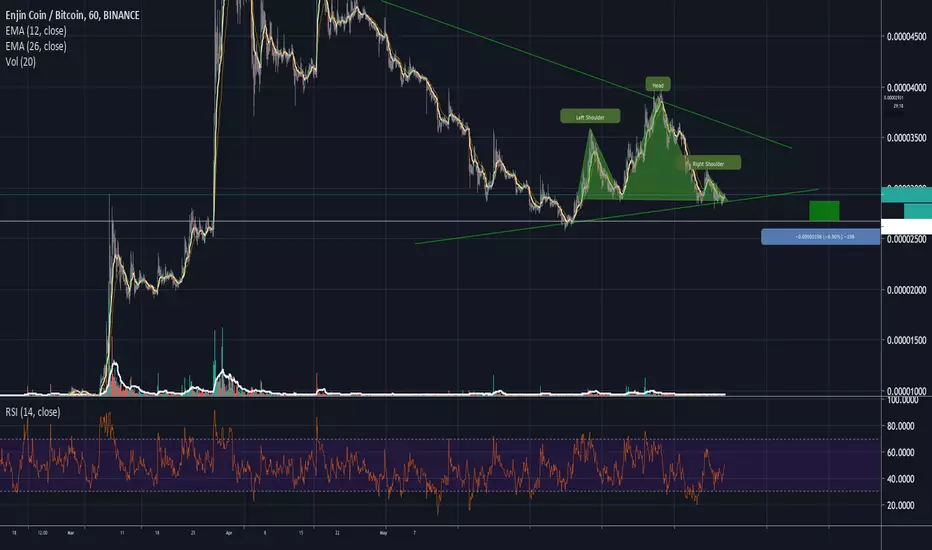
I can see 2 pattern on this chart;
1. A symmetrical Triangle
2. Head and Shoulders
If the supportline from both patterns break than we might see a -7% drop before next supportline.
I make this charts to learn more about technical analyses, thoughts from others are welcome!
1. A symmetrical Triangle
2. Head and Shoulders
If the supportline from both patterns break than we might see a -7% drop before next supportline.
I make this charts to learn more about technical analyses, thoughts from others are welcome!
Trade closed: target reached
CHECK IT OUT 😎
⬇️⬇️⬇️
youtube.com/channel/UC_UP6XvTaTEKIapdM-aKzWA
twitter.com/TheChartingArt
⬇️⬇️⬇️
youtube.com/channel/UC_UP6XvTaTEKIapdM-aKzWA
twitter.com/TheChartingArt
Disclaimer
The information and publications are not meant to be, and do not constitute, financial, investment, trading, or other types of advice or recommendations supplied or endorsed by TradingView. Read more in the Terms of Use.
Disclaimer
The information and publications are not meant to be, and do not constitute, financial, investment, trading, or other types of advice or recommendations supplied or endorsed by TradingView. Read more in the Terms of Use.