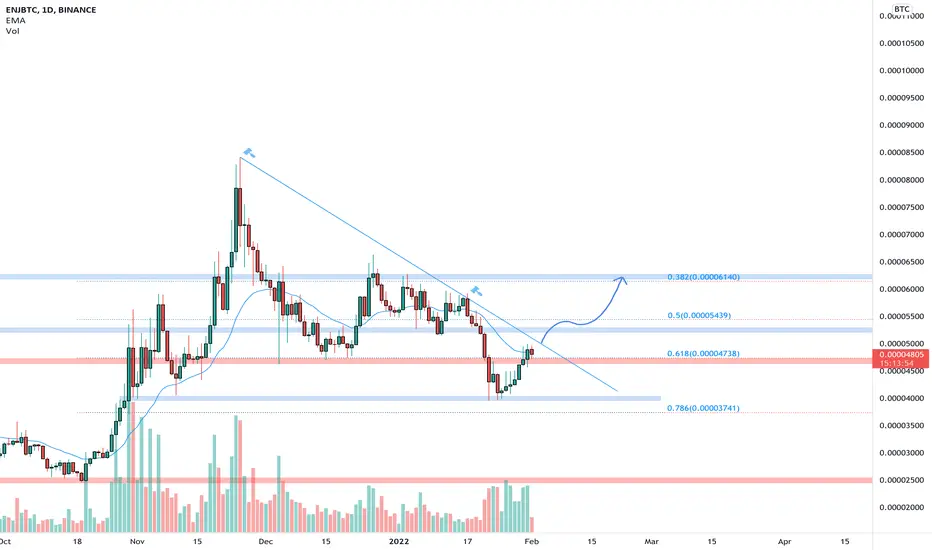
The price is testing the dynamic resistance on the daily timeframe after the price bounced on the daily support close to 0.786 Fibonacci level.
Right now the market is testing the weekly resistance as new support.
How to approach?
IF the price is going to have a breakout from the daily resistance, we could see a bullish impulse until the next resistance around 0.0006140
A breakout is not enough, you need to have a strategy!
–––––
Follow the Shrimp 🦐
Keep in mind.
- 🟣 Purple structure -> Monthly structure.
- 🔴 Red structure -> Weekly structure.
- 🔵 Blue structure -> Daily structure.
- 🟡 Yellow structure -> 4h structure.
Disclaimer
The information and publications are not meant to be, and do not constitute, financial, investment, trading, or other types of advice or recommendations supplied or endorsed by TradingView. Read more in the Terms of Use.
Disclaimer
The information and publications are not meant to be, and do not constitute, financial, investment, trading, or other types of advice or recommendations supplied or endorsed by TradingView. Read more in the Terms of Use.