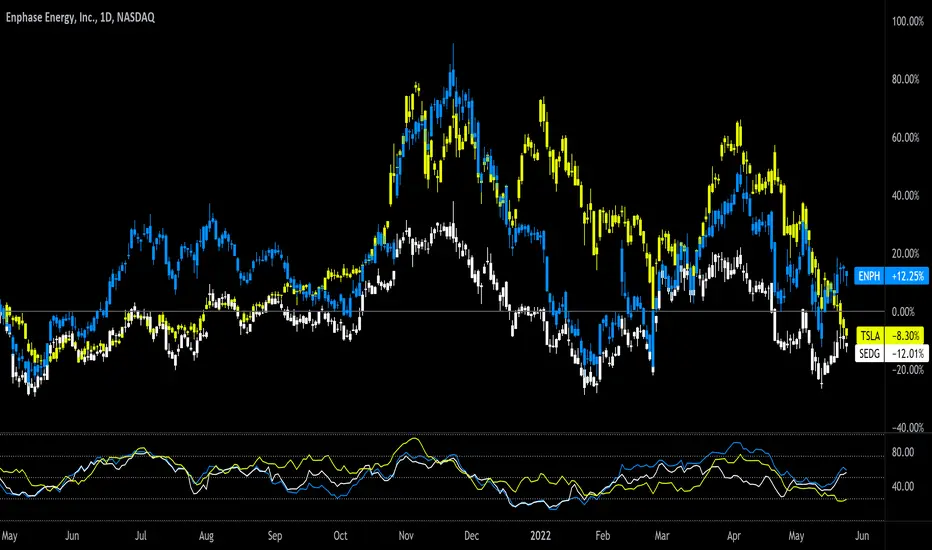
Solar company comparison YTD:
ENPH +11.96%
TSLA -8.59%
SEDG -12.42%
Do your own due diligence, your risk is 100% your responsibility. This is for educational and entertainment purposes only. You win some or you learn some. Consider being charitable with some of your profit to help humankind. Good luck and happy trading friends...
*3x lucky 7s of trading*
7pt Trading compass:
Price action, entry/exit
Volume average/direction
Trend, patterns, momentum
Newsworthy current events
Revenue
Earnings
Balance sheet
7 Common mistakes:
+5% portfolio trades, capital risk management
Beware of analyst's motives
Emotions & Opinions
FOMO : bad timing, the market is ruthless, be shrewd
Lack of planning & discipline
Forgetting restraint
Obdurate repetitive errors, no adaptation
7 Important tools:
Trading View app!, Brokerage UI
Accurate indicators & settings
Wide screen monitor/s
Trading log (pencil & graph paper)
Big, organized desk
Reading books, playing chess
Sorted watch-list
Checkout my indicators:
Fibonacci VIP - volume
Fibonacci MA7 - price
pi RSI - trend momentum
TTC - trend channel
AlertiT - notification
tickerTracker - MFI Oscillator
tradingview.com/u/growerik/
Note
TSLA $624 - $755 since this long postNote
ENPH $161-$189 since 5/24Note
SEDG $244-$280 since 5/24Note
TAN up again today.Trading indicators:
tradingview.com/u/Options360/
tradingview.com/u/Options360/
Disclaimer
The information and publications are not meant to be, and do not constitute, financial, investment, trading, or other types of advice or recommendations supplied or endorsed by TradingView. Read more in the Terms of Use.
Trading indicators:
tradingview.com/u/Options360/
tradingview.com/u/Options360/
Disclaimer
The information and publications are not meant to be, and do not constitute, financial, investment, trading, or other types of advice or recommendations supplied or endorsed by TradingView. Read more in the Terms of Use.