Hello, traders.
If you "Follow", you can always get the latest information quickly.
Have a nice day today.
-------------------------------------
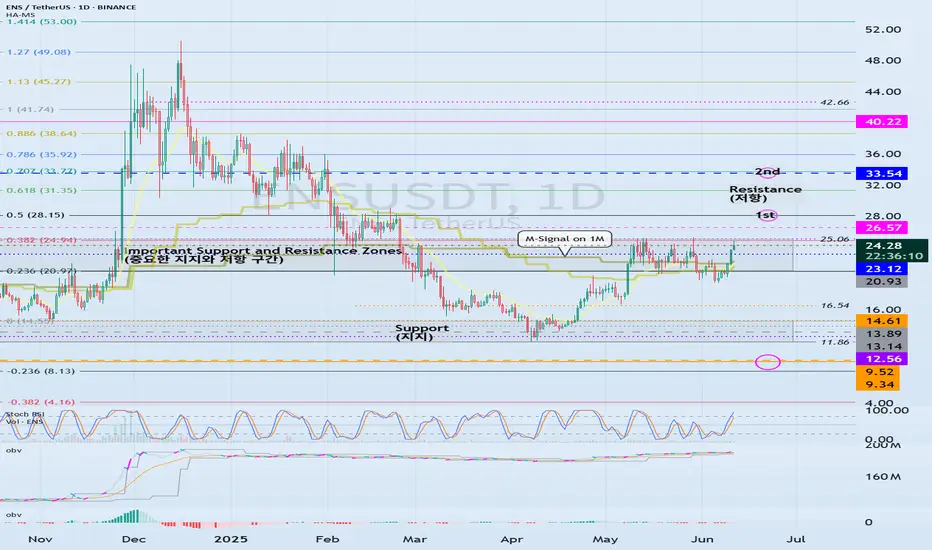
(ENSUSDT 1D chart)
The key is whether the price can be maintained by rising above the important support and resistance zone of 20.93-25.06.
If it fails to rise, it is likely to fall to the support zone of 11.86-14.61, so you should think about a response plan for this.
However, the 20.93 point is a volume profile zone, so you should check whether it is supported when falling to this area.
If it starts to rise,
1st: 28.15
2nd: 33.54
The 1st and 2nd areas above are likely to act as resistance.
-
The indicators used as basic trading strategies are the HA-Low indicator and the HA-High indicator.
The basic trading strategy is to buy near the HA-Low indicator and sell near the HA-High indicator.
However, if it is supported by the HA-High indicator and rises, it is likely to show a stepwise upward trend, and if it is resisted by the HA-Low indicator and falls, it is likely to show a stepwise downward trend.
Therefore, the trading method should be a split trading method.
The end of the stepwise upward trend is a decline, and the end of the stepwise downward trend is an increase.
Therefore, if you buy when the HA-High indicator is supported and rises, a short and quick response is required.
Accordingly, it is not recommended to use the HA-High indicator as the first purchase point.
If you are familiar with day trading, the HA-High indicator may also be a purchase point.
Currently, the HA-Low indicator is formed at the 14.61 point, and the HA-High indicator is formed at the 23.12 point.
-
Depending on the arrangement of the candles, the important support and resistance zones are in the 20.93-25.06 zone.
Therefore, regardless of the current HA-High indicator position, if it shows support above 25.06, it is a time to buy.
However, since the buy zone and resistance zone are close, a quick response is required.
Therefore, the support and resistance points drawn on the 1M, 1W, and 1D charts correspond to important trading strategy points.
In order to draw reliable support and resistance points, objective information is required.
Be careful because the support and resistance points drawn after starting a transaction may reflect your psychological state and become unreliable support and resistance points.
-
Thank you for reading to the end.
I wish you successful trading.
--------------------------------------------------
- This is an explanation of the big picture.
(3-year bull market, 1-year bear market pattern)

I will explain more details when the bear market starts.
------------------------------------------------------
Other content (coins, stocks, etc.) is frequently posted on X.
X에 다른 내용(코인, 주식 등)이 자주 게시.
◆ t.me/readCryptoChannel
[HA-MS Indicator]
bit.ly/3YxHgvN
[OBV Indicator]
bit.ly/4dcyny3
X에 다른 내용(코인, 주식 등)이 자주 게시.
◆ t.me/readCryptoChannel
[HA-MS Indicator]
bit.ly/3YxHgvN
[OBV Indicator]
bit.ly/4dcyny3
Related publications
Disclaimer
The information and publications are not meant to be, and do not constitute, financial, investment, trading, or other types of advice or recommendations supplied or endorsed by TradingView. Read more in the Terms of Use.