In month chart,
The candles were still restricted into a small box.
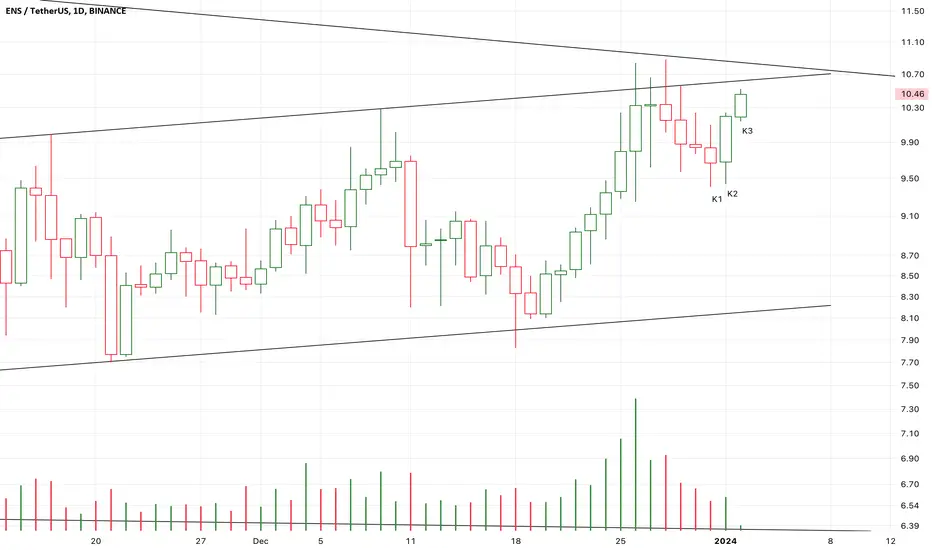
If K4 break up K3, it will likely accelerating.
In week chat,
K2 failed to close upon the box,
But the candles stay near the top line of the Box.
The possibility of break up is increasing.
If this week’s candle break up the parallel Channel,
A potential bullish double bottom pattern will established.
Will K3 break up the parallel channel ?
I don’t know.
K2 is a bullish engulfing candle, and swallow three red candle body.
It seems to be strong enough.
K3 must verify that, if not, the risk will increase.
Note
After breaking up 27USD,
The price is in an overbuying status,
A nearest potential resistance is at about 1.5fib line(at about 34-35usd)
If I find evidence (usually, it is the sharply increasing volume) to verify the expectations,
I will try to decrease my long positions there.
Disclaimer
The information and publications are not meant to be, and do not constitute, financial, investment, trading, or other types of advice or recommendations supplied or endorsed by TradingView. Read more in the Terms of Use.
Disclaimer
The information and publications are not meant to be, and do not constitute, financial, investment, trading, or other types of advice or recommendations supplied or endorsed by TradingView. Read more in the Terms of Use.