EENS/USDT Chart Analysis 🚀
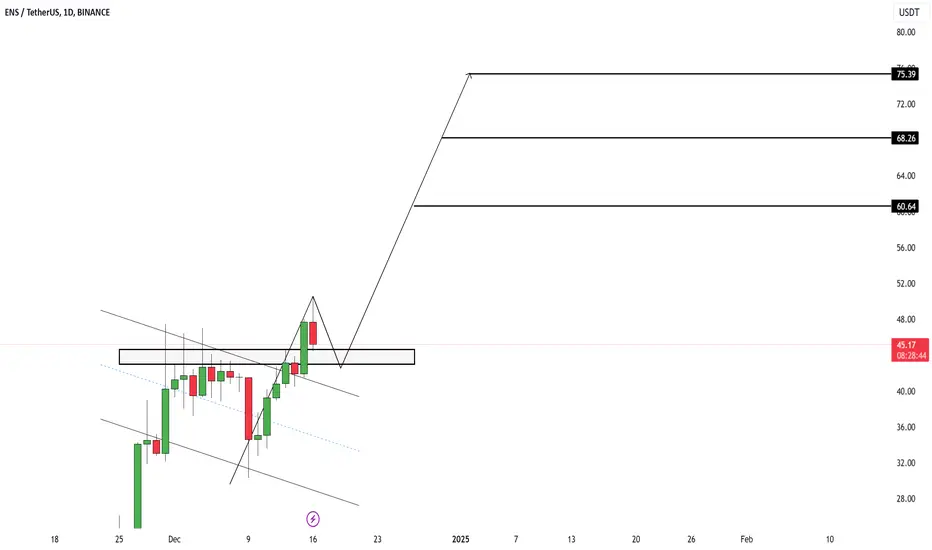
The #ENS/USDT chart shows a potential retracement into the Fibonacci Buy Zone between $37.61 (0.618) and $34.03 (0.786), presenting an ideal buy opportunity for accumulation. Resistance levels are clearly identified at $52.99, $61.45, and the upper target at $69.08. If the price holds and rebounds from the Fibo zone, the risk-to-reward ratio becomes highly favorable, while a stop-loss should be placed below $29.50 to minimize downside risk. Overall, the chart signals a bullish breakout scenario after retracement. 🚀
The #ENS/USDT chart shows a potential retracement into the Fibonacci Buy Zone between $37.61 (0.618) and $34.03 (0.786), presenting an ideal buy opportunity for accumulation. Resistance levels are clearly identified at $52.99, $61.45, and the upper target at $69.08. If the price holds and rebounds from the Fibo zone, the risk-to-reward ratio becomes highly favorable, while a stop-loss should be placed below $29.50 to minimize downside risk. Overall, the chart signals a bullish breakout scenario after retracement. 🚀
Subscribe to my Telegram Channel 👉 :
t.me/addlist/y5mi70s3c0Y3MDQ0
Subscribe to my X 👉 : x.com/VIPROSETR
t.me/addlist/y5mi70s3c0Y3MDQ0
Subscribe to my X 👉 : x.com/VIPROSETR
Disclaimer
The information and publications are not meant to be, and do not constitute, financial, investment, trading, or other types of advice or recommendations supplied or endorsed by TradingView. Read more in the Terms of Use.