4H CHART EXPLANATION:
Main Items we see on the chart:
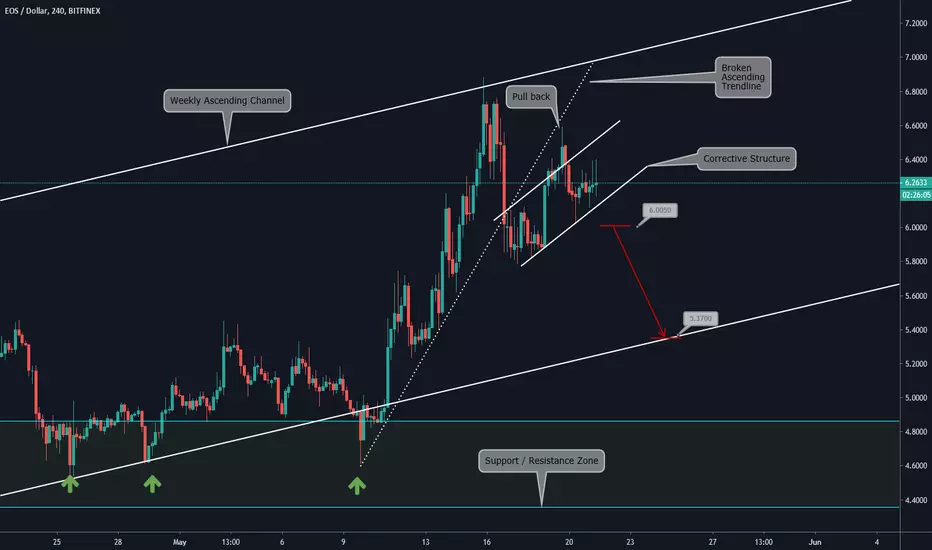
-Price has broken the ascending trendline after bouncing on the weekly ascending channel
-Price couldn't re-enter the previous zone after a Pullback to the broken ascending trendline
-Currently, we can see the price inside a corrective structure
-Based on this if the price breaks out the corrective structure and closes below 6.0050 we expect a continuation of the downward movement towards 5.3700
MULTI TIMEFRAME VISION:
-Weekly :

-Daily:

Main Items we see on the chart:
-Price has broken the ascending trendline after bouncing on the weekly ascending channel
-Price couldn't re-enter the previous zone after a Pullback to the broken ascending trendline
-Currently, we can see the price inside a corrective structure
-Based on this if the price breaks out the corrective structure and closes below 6.0050 we expect a continuation of the downward movement towards 5.3700
MULTI TIMEFRAME VISION:
-Weekly :
-Daily:
Disclaimer
The information and publications are not meant to be, and do not constitute, financial, investment, trading, or other types of advice or recommendations supplied or endorsed by TradingView. Read more in the Terms of Use.
Disclaimer
The information and publications are not meant to be, and do not constitute, financial, investment, trading, or other types of advice or recommendations supplied or endorsed by TradingView. Read more in the Terms of Use.