Long
EOS/BTC Log Chart 3Day - ugly, but end is near
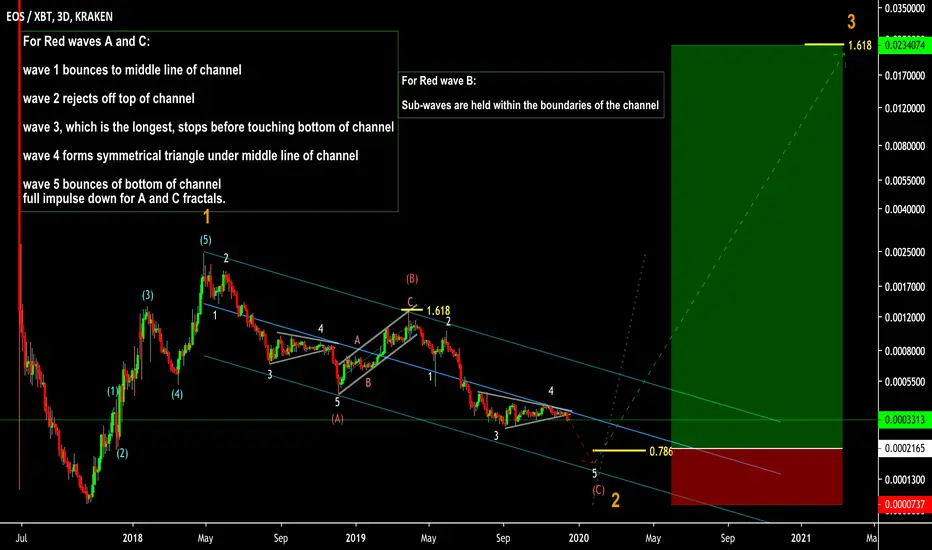
EOS/BTC Log Chart 3Day - ugly, but end is near
For Red waves A and C:
wave 1 bounces to middle line of channel
wave 2 rejects off top of channel
wave 3, which is the longest, stops before touching bottom of channel
wave 4 forms symmetrical triangle under middle line of channel
wave 5 bounces of bottom of channel
full impulse down for A and C fractals.
For Red wave B:
Sub-waves are held within the boundaries of the channel
Disclaimer
The information and publications are not meant to be, and do not constitute, financial, investment, trading, or other types of advice or recommendations supplied or endorsed by TradingView. Read more in the Terms of Use.
Disclaimer
The information and publications are not meant to be, and do not constitute, financial, investment, trading, or other types of advice or recommendations supplied or endorsed by TradingView. Read more in the Terms of Use.