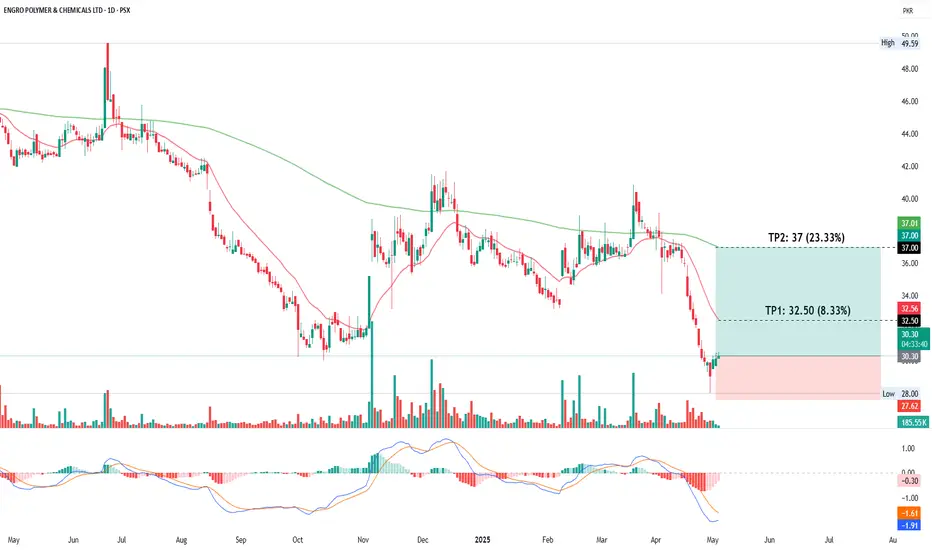
The daily chart of EPCL indicates a potential bullish reversal. The price recently rebounded from a low near 28 and is now trading at 30.50, showing signs of recovery. The MACD indicator is on the verge of a bullish crossover, suggesting increasing upward momentum. The immediate target (TP1) is 32.50, which aligns with the 20-day EMA, while the second target (TP2) is set at 37.00, corresponding to the 200-day EMA. These levels represent 8.33% and 23.33% potential gains, respectively, and may serve as key resistance levels in the short to medium term.
Disclaimer
The information and publications are not meant to be, and do not constitute, financial, investment, trading, or other types of advice or recommendations supplied or endorsed by TradingView. Read more in the Terms of Use.
Disclaimer
The information and publications are not meant to be, and do not constitute, financial, investment, trading, or other types of advice or recommendations supplied or endorsed by TradingView. Read more in the Terms of Use.