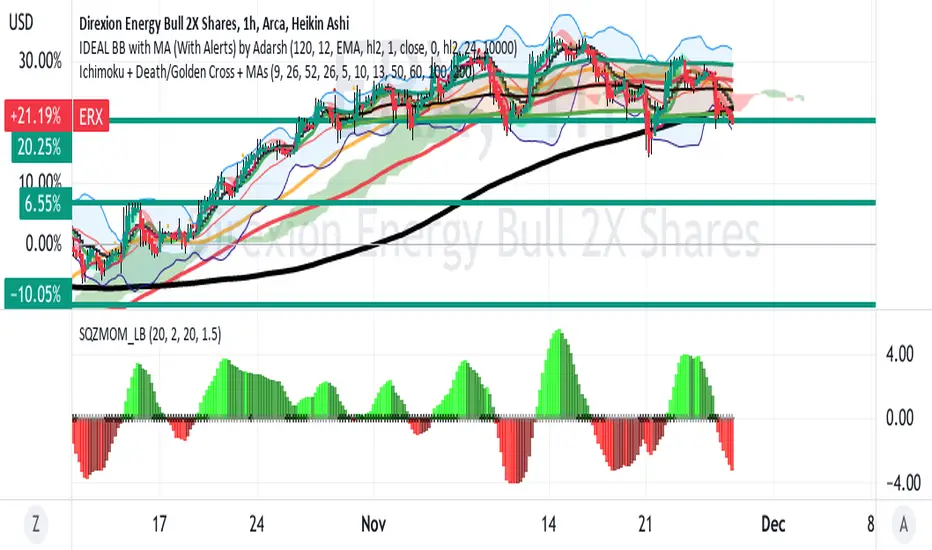
On the one hour chart, ERX ( triple energy ETF) completed a head and shoulders
and is now downtrending with a crash through the EMA 100 and EMA 200
and now one standard deviation below the VWAP. The Momentum Indicator
shows downside momentum is greater than it has been in recent months.
The inverse ETF called the ERY would be expected to be the inverse of this.
The XLE would be similar but not triple leveraged.
This appears to be setup for a good long term swing short or a put option
expiring in late January or February.
Disclaimer
The information and publications are not meant to be, and do not constitute, financial, investment, trading, or other types of advice or recommendations supplied or endorsed by TradingView. Read more in the Terms of Use.
Disclaimer
The information and publications are not meant to be, and do not constitute, financial, investment, trading, or other types of advice or recommendations supplied or endorsed by TradingView. Read more in the Terms of Use.