***QUOTING SEP CONTRACT FOR JUNE CONTRACT OR CASH US500 EQUIVALENT LEVELS SUBTRACT ~52 POINTS***
***WEEKLY ACTION AREA VIDEO TO FOLLOW AHEAD OF NY OPEN***
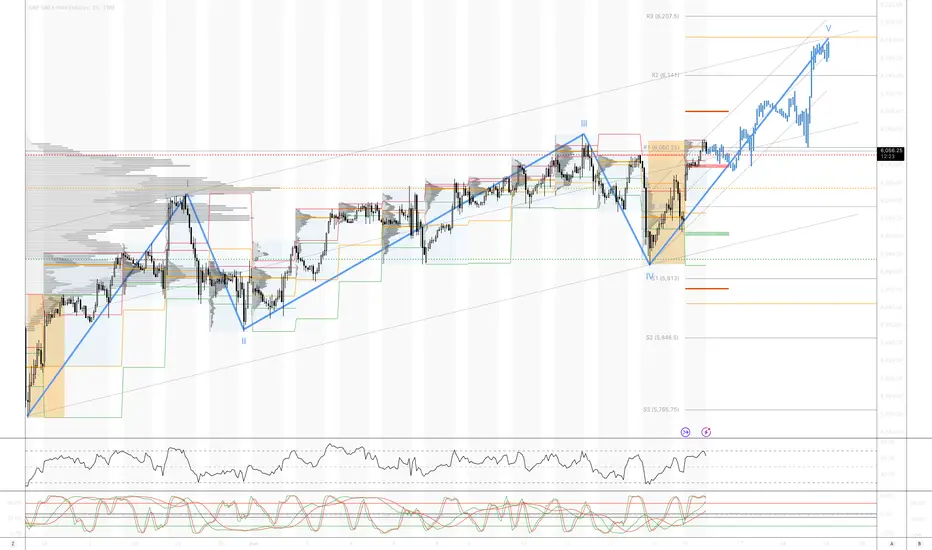
WEEKLY BULL BEAR ZONE 6090/6100
WEEKLY RANGE RES 6150 SUP 5914
DAILY RANGE RES 6090 SUP 5972
DAILY VWAP BULLISH 6019
WEEKLY VWAP BULLISH 5923
DAILY BALANCE - 6064/5965
WEEKLY ONE TIME FRAMING UP - 5965
MONTHLY ONE TIME FRAMING UP
GAP LEVELS 5843/5741/5710/5339
Balance: This refers to a market condition where prices move within a defined range, reflecting uncertainty as participants await further market-generated information. Our approach to balance includes favoring fade trades at the range extremes (highs/lows) while preparing for potential breakout scenarios if the balance shifts.
One-Time Framing Up (OTFU): This represents a market trend where each successive bar forms a higher low, signaling a strong and consistent upward movement.
One-Time Framing Down (OTFD): This describes a market trend where each successive bar forms a lower high, indicating a pronounced and steady downward movement.
GOLDMAN SACHS TRADING DESK VIEWS
Weekend Cross-Asset Dislocations (15-Jun-2025)
Oil Options Positioning Reaches Extreme Levels
On Friday, call buying in oil pushed the put-call skew to one of its most extreme levels in over 25 years. This indicates that investors are positioning for significant upside asymmetry. Notably, the shift in the put-call skew far exceeded the movement in near-term oil futures, compared to similar past episodes.
AI-Related Capex Remains Steady
Our analysts report that capex spending for 2025 and 2026 by the six largest hyperscalers has remained stable over the past few months. Bearish investors might interpret the absence of upward revisions as a sign of slowing momentum in the broader AI sector. Conversely, bullish investors could view the rebound in stock prices as a signal of growing confidence in hyperscalers and other AI-exposed companies to generate revenue sufficient to support planned capex.
Sector-Specific Divergences in Put-Call Skew
Friday saw notable divergences in put-call skew across sectors, highlighting the varied impact of global events. Increased call-buying pressure in energy aligns with the extreme shift in oil’s put-call skew. Meanwhile, rising put-call skew in Materials and Financials reflects heightened downside concerns, with Materials put-buying signaling fears of a broader economic slowdown.
Balanced Positioning in Single Stock Put-Call Skew
Despite sector-specific disparities, single-stock positioning remains balanced. The average stock’s put-call skew has returned to levels seen in March 2025, before the US tariff announcements.
IG Credit Spreads Tight Relative to Equities
Investment-grade (IG) equity investors appear more cautious than their credit counterparts, likely due to elevated uncertainty around US interest rates. A potential rate increase could disproportionately impact IG equity valuations.
Retail Investor Activity Remains Stable
Retail investor volumes have aligned with their five-year average, suggesting they remain engaged but have not been a dominant driver of equity performance in recent weeks. For single stocks, retail investors have been in a holding pattern, having shifted from net buyers earlier this year to small net sellers recently. This suggests they may be waiting for a broader market dip to resume buying.
SPX Daily Options Pricing Reflects Steady Volatility
SPX options are pricing daily moves between 0.9% and 1.2% over the next four weeks. Notably, options for this week’s FOMC meeting are pricing a relatively low ±0.9% move. While a ±1.2% move is priced for July 7, uncertainty remains regarding the volatility impact of the tax bill and the end of the 90-day tariff pause.
Professional Investors Maintain Cautious Stance
Entering 2025, professional investors significantly reduced their demand for leveraged equity exposure through futures, swaps, and options, signaling potential downside risks. While this trend has continued, the pace of selling has slowed in recent weeks, making the cautionary signal less alarming.
Wednesday marks the VIX expiry, which we believe has been supporting the market. Thursday is a market holiday, and Friday brings option expiry, likely leading to a high out-of-office session as risk-taking eases. The market may challenge crowded trades, with "short oil" being noted as particularly crowded.
1. Positioning (i): Hedge funds have been buying U.S. equities for six consecutive weeks, with net leverage exceeding 50% after reaching a five-year low in April. Despite a generally bearish outlook, investors are positioned bullishly due to limited alternatives.
2. Positioning (ii): Sector flows show increased risk aversion, with strong demand in utilities and significant supply in consumer discretionary sectors.
3. Positioning (iii): The systematic community remains long on stocks and is unlikely to sell significantly unless conditions worsen. The key level to watch in the SPX is 5800, both medium-term and short-term.
4. Flows (i): The long-only community has finally turned to buying stocks after three weeks of selling imbalances, ending $10 billion better to buy across all sectors.
5. Flows (ii): As the June expiry approaches, SPX call open interest is at an all-time high with 8.7 million contracts.
6. Trades (i): In derivatives, there have been buyers of VIX puts extending to July, with a significant premium built into the VIX curve. SPX realized volatility is at 12, while July VIX is nearly double that. Outright puts are intriguing, and some VIX puts were traded contingent on SPX falling below a certain level.
7. Trades (ii): Our cash desk believes the AI theme is gaining momentum. Callahan notes the increased visibility around GenAI as the biggest takeaway from the week. The Ellison earnings transcript highlights "astronomical" demand.
8. Trades (iii): The Goldman Sachs house view and consensus suggest that gold will continue its rapid rise. A July 97% put costs 100 basis points, representing the maximum loss premium paid.
***WEEKLY ACTION AREA VIDEO TO FOLLOW AHEAD OF NY OPEN***
WEEKLY BULL BEAR ZONE 6090/6100
WEEKLY RANGE RES 6150 SUP 5914
DAILY RANGE RES 6090 SUP 5972
DAILY VWAP BULLISH 6019
WEEKLY VWAP BULLISH 5923
DAILY BALANCE - 6064/5965
WEEKLY ONE TIME FRAMING UP - 5965
MONTHLY ONE TIME FRAMING UP
GAP LEVELS 5843/5741/5710/5339
Balance: This refers to a market condition where prices move within a defined range, reflecting uncertainty as participants await further market-generated information. Our approach to balance includes favoring fade trades at the range extremes (highs/lows) while preparing for potential breakout scenarios if the balance shifts.
One-Time Framing Up (OTFU): This represents a market trend where each successive bar forms a higher low, signaling a strong and consistent upward movement.
One-Time Framing Down (OTFD): This describes a market trend where each successive bar forms a lower high, indicating a pronounced and steady downward movement.
GOLDMAN SACHS TRADING DESK VIEWS
Weekend Cross-Asset Dislocations (15-Jun-2025)
Oil Options Positioning Reaches Extreme Levels
On Friday, call buying in oil pushed the put-call skew to one of its most extreme levels in over 25 years. This indicates that investors are positioning for significant upside asymmetry. Notably, the shift in the put-call skew far exceeded the movement in near-term oil futures, compared to similar past episodes.
AI-Related Capex Remains Steady
Our analysts report that capex spending for 2025 and 2026 by the six largest hyperscalers has remained stable over the past few months. Bearish investors might interpret the absence of upward revisions as a sign of slowing momentum in the broader AI sector. Conversely, bullish investors could view the rebound in stock prices as a signal of growing confidence in hyperscalers and other AI-exposed companies to generate revenue sufficient to support planned capex.
Sector-Specific Divergences in Put-Call Skew
Friday saw notable divergences in put-call skew across sectors, highlighting the varied impact of global events. Increased call-buying pressure in energy aligns with the extreme shift in oil’s put-call skew. Meanwhile, rising put-call skew in Materials and Financials reflects heightened downside concerns, with Materials put-buying signaling fears of a broader economic slowdown.
Balanced Positioning in Single Stock Put-Call Skew
Despite sector-specific disparities, single-stock positioning remains balanced. The average stock’s put-call skew has returned to levels seen in March 2025, before the US tariff announcements.
IG Credit Spreads Tight Relative to Equities
Investment-grade (IG) equity investors appear more cautious than their credit counterparts, likely due to elevated uncertainty around US interest rates. A potential rate increase could disproportionately impact IG equity valuations.
Retail Investor Activity Remains Stable
Retail investor volumes have aligned with their five-year average, suggesting they remain engaged but have not been a dominant driver of equity performance in recent weeks. For single stocks, retail investors have been in a holding pattern, having shifted from net buyers earlier this year to small net sellers recently. This suggests they may be waiting for a broader market dip to resume buying.
SPX Daily Options Pricing Reflects Steady Volatility
SPX options are pricing daily moves between 0.9% and 1.2% over the next four weeks. Notably, options for this week’s FOMC meeting are pricing a relatively low ±0.9% move. While a ±1.2% move is priced for July 7, uncertainty remains regarding the volatility impact of the tax bill and the end of the 90-day tariff pause.
Professional Investors Maintain Cautious Stance
Entering 2025, professional investors significantly reduced their demand for leveraged equity exposure through futures, swaps, and options, signaling potential downside risks. While this trend has continued, the pace of selling has slowed in recent weeks, making the cautionary signal less alarming.
Wednesday marks the VIX expiry, which we believe has been supporting the market. Thursday is a market holiday, and Friday brings option expiry, likely leading to a high out-of-office session as risk-taking eases. The market may challenge crowded trades, with "short oil" being noted as particularly crowded.
1. Positioning (i): Hedge funds have been buying U.S. equities for six consecutive weeks, with net leverage exceeding 50% after reaching a five-year low in April. Despite a generally bearish outlook, investors are positioned bullishly due to limited alternatives.
2. Positioning (ii): Sector flows show increased risk aversion, with strong demand in utilities and significant supply in consumer discretionary sectors.
3. Positioning (iii): The systematic community remains long on stocks and is unlikely to sell significantly unless conditions worsen. The key level to watch in the SPX is 5800, both medium-term and short-term.
4. Flows (i): The long-only community has finally turned to buying stocks after three weeks of selling imbalances, ending $10 billion better to buy across all sectors.
5. Flows (ii): As the June expiry approaches, SPX call open interest is at an all-time high with 8.7 million contracts.
6. Trades (i): In derivatives, there have been buyers of VIX puts extending to July, with a significant premium built into the VIX curve. SPX realized volatility is at 12, while July VIX is nearly double that. Outright puts are intriguing, and some VIX puts were traded contingent on SPX falling below a certain level.
7. Trades (ii): Our cash desk believes the AI theme is gaining momentum. Callahan notes the increased visibility around GenAI as the biggest takeaway from the week. The Ellison earnings transcript highlights "astronomical" demand.
8. Trades (iii): The Goldman Sachs house view and consensus suggest that gold will continue its rapid rise. A July 97% put costs 100 basis points, representing the maximum loss premium paid.
This analysis is provided as general market commentary and does not constitute investment advice. Past performance is not indicative of future results
Disclaimer
The information and publications are not meant to be, and do not constitute, financial, investment, trading, or other types of advice or recommendations supplied or endorsed by TradingView. Read more in the Terms of Use.
Disclaimer
The information and publications are not meant to be, and do not constitute, financial, investment, trading, or other types of advice or recommendations supplied or endorsed by TradingView. Read more in the Terms of Use.