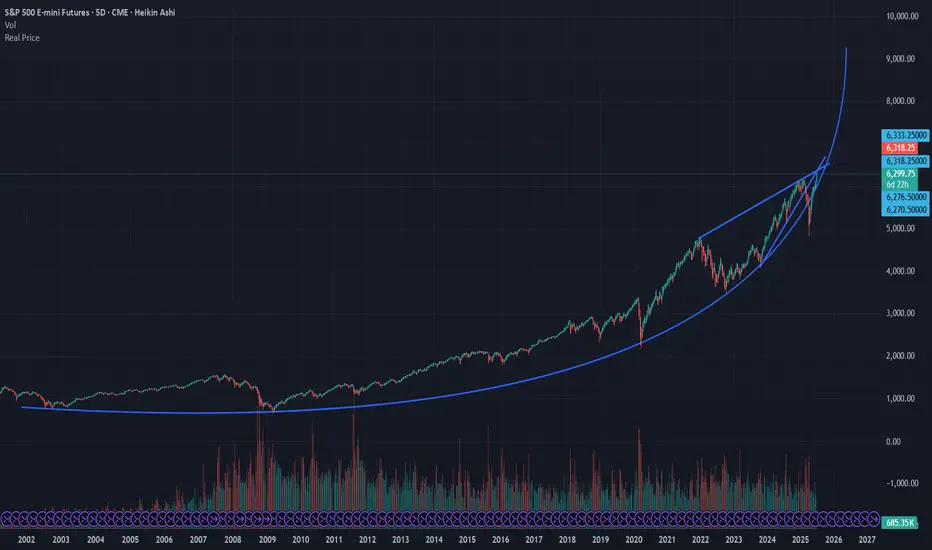
See here the entire futures contract (ES front contract) history for the S and P. What becomes very clear from connecting the lows is that the S and P has been growing parabolic over its futures chart *entire* history.
So we are now at an inflection point in the stock market history. For the first time this year, we below the parabolic arc. It reclaimed it in May to only right now be bumping up against two major intersecting resistance lines.
If we break through, hold on to your hats because we are going wayyyyy higher. Just to keep the parabolic growth curve would put us 50% higher by next year. If we breakdown, look out below. There is no support below this parabolic arc and the implosion could be catastrophic.
Either way good luck and happy trading!
Disclaimer
The information and publications are not meant to be, and do not constitute, financial, investment, trading, or other types of advice or recommendations supplied or endorsed by TradingView. Read more in the Terms of Use.
Disclaimer
The information and publications are not meant to be, and do not constitute, financial, investment, trading, or other types of advice or recommendations supplied or endorsed by TradingView. Read more in the Terms of Use.