1. Market Context
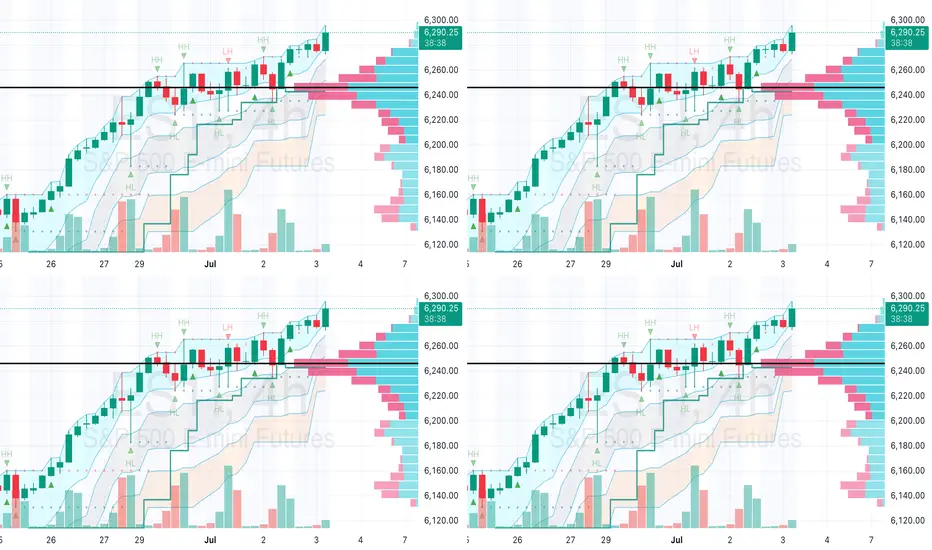
Timeframe: The chart covers late June to early July 2025, with daily candlesticks showing recent price action.
Trend: The price has been in an uptrend, breaking resistance around 6,180.00 and testing 6,290.00-6,300.00. This suggests bullish momentum, but the move is nearing a key resistance zone.
2. Key Levels
Support: 6,180.00-6,200.00, where prior consolidation and moving averages align, offering a potential entry or stop-loss zone.
Resistance: 6,300.00 is a critical level. A break above could target 6,350.00, while failure might lead to a reversal.
Stop Loss: Place below support (e.g., 6,170.00) to protect against a breakdown, adjusting for your risk tolerance.
Take Profit: Aim for 6,350.00 if bullish, or scale out at 6,290.00 if you expect resistance to hold.
3. Technical Indicators
Candlestick Patterns: Recent green candles indicate buying pressure, but watch for reversal signals (e.g., doji or shooting star) near 6,300.00.
Volume: At 77.04K, it’s moderate. A surge on a breakout would confirm strength; a drop might signal exhaustion.
Moving Averages: The chart shows multiple MAs (e.g., 50-day, 200-day). If the price is above them, it supports the bullish case; a cross below could indicate a shift.
4. Trade Plan
Entry: Consider entering long near 6,290.00 if the price consolidates or breaks 6,300.00 with volume confirmation.
Risk-Reward Ratio: Aim for at least 1:2 (e.g., risk 20 points to gain 40 points toward 6,350.00).
Position Sizing: Calculate based on your account size and risk per trade (e.g., 1-2% of capital).
Exit Strategy: Take partial profits at 6,320.00 and let the rest ride with a trailing stop, or exit fully if resistance holds.
5. Risk Management
Volatility: The range (6,120.00-6,300.00) suggests moderate volatility. Adjust position size accordingly.
News/Event Risk: Check for upcoming economic data or earnings that could impact the instrument.
6. Scenario Analysis
Bullish Case: Break above 6,300.00 with strong volume could push to 6,350.00+. Monitor for follow-through.
Bearish Case: Rejection at 6,300.00 with a red candle might drop to 6,180.00. Prepare to cut losses quickly.
Join my trading community on Discord! 📈 Use all our indicators for FREE
discord.gg/xPEDcNEupw
discord.gg/xPEDcNEupw
Disclaimer
The information and publications are not meant to be, and do not constitute, financial, investment, trading, or other types of advice or recommendations supplied or endorsed by TradingView. Read more in the Terms of Use.