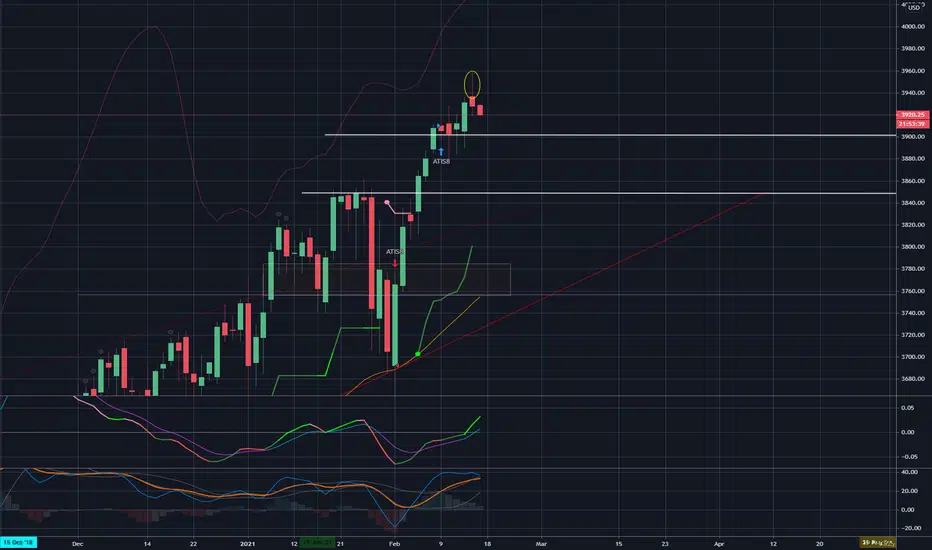
Interestingly, while media headlines today talk about an all time high, the candlestick pattern is missed totally, and I think does give a subtle warning.
The long tail at the very top is an indication that this is a significant hurfdle to overcome IF the index is to push further. It is also telling us that there is a lot of sell pressure and should continue for the next day. Later on, we should see a lower high forming.
MACD is supporting a retracement of sort, but the RPM supports a continued bullish outlook.
Until then, clearly still bullish; just an early bump worth noting in my humble opinion...
Note
And so it goes... down past the two support lines since.Over and above that, notice that the candles are getting longer (stronger momentum), so selling pressure IS buckling the immediate supports.
Looking for 3750 perhaps. Be war that if it does not hold...
Related publications
Disclaimer
The information and publications are not meant to be, and do not constitute, financial, investment, trading, or other types of advice or recommendations supplied or endorsed by TradingView. Read more in the Terms of Use.
Related publications
Disclaimer
The information and publications are not meant to be, and do not constitute, financial, investment, trading, or other types of advice or recommendations supplied or endorsed by TradingView. Read more in the Terms of Use.