Hi everyone,
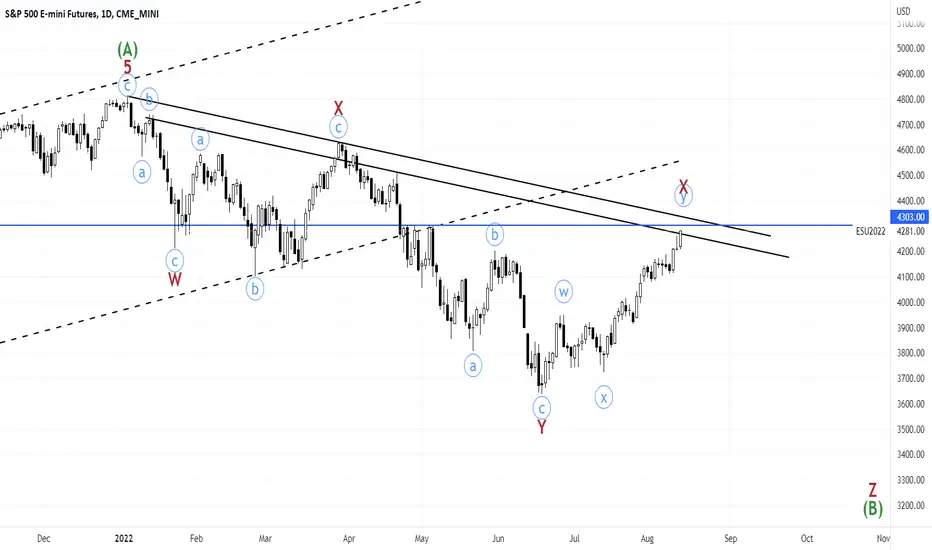
Overview: let's do a quick review of my expectations in the past two months:
since June 15th, we were prepared for the market bottoming out for wave Y and then a pullback as wave X.
June 17th: "I see us completing wave Y (second zigzag ) soon, most probably by end of today. What comes next is another wave X and then the third zigzag , Z to the actual market bottom."
June 24th: "We can consider several different targets for this wave X such as 4170 range or 4300 range. For now, I am considering it as a zigzag development, but it can be developed in any kind of corrective structures."
June 28th: "we started thinking that wave X is developing as a double or triple zigzag , which is still a valid point. However, the subwaves of this X wave developed in a different way than we anticipated."
July 25th: "this week is going to be very volatile with all big tech ER and FOMC on Wednesday. If we break the lower black trendline, the count is invalidated and the market has already topped, going for new lows (leg Z)." Since wave X started to develop, this was my first time I was guessing that the peak for wave X was in.
July 29th: "with this strength caused mainly by aapl and amzn ER, I am doing a major relabeling in wave X" and "I now favor 4300 range as wave X top".
August 11th: "I have to do a little bit of relabeling to wave (c) of y of X. Right now, I see us extending in wave V of (c) of y of X. Potential targets for wave X peak (4290-4310):"
Note: my goal in doing this review is to make up my mind before continuing with the update. I am not implying that I was never wrong in this process of analysis, which is definitely a part of this game. Also, if you go back and hit the play button on the updates, what you can see is that most of the times, we could get the right direction of the market the following day.
Update: let's look at the 4h chart: I see us extending in wave C of V of (c) of y of X. I am still considering the same potential target for wave X peak: 4290-4310
Note
An update on the hourly chartRelated publications
Disclaimer
The information and publications are not meant to be, and do not constitute, financial, investment, trading, or other types of advice or recommendations supplied or endorsed by TradingView. Read more in the Terms of Use.
Related publications
Disclaimer
The information and publications are not meant to be, and do not constitute, financial, investment, trading, or other types of advice or recommendations supplied or endorsed by TradingView. Read more in the Terms of Use.