Key Observations
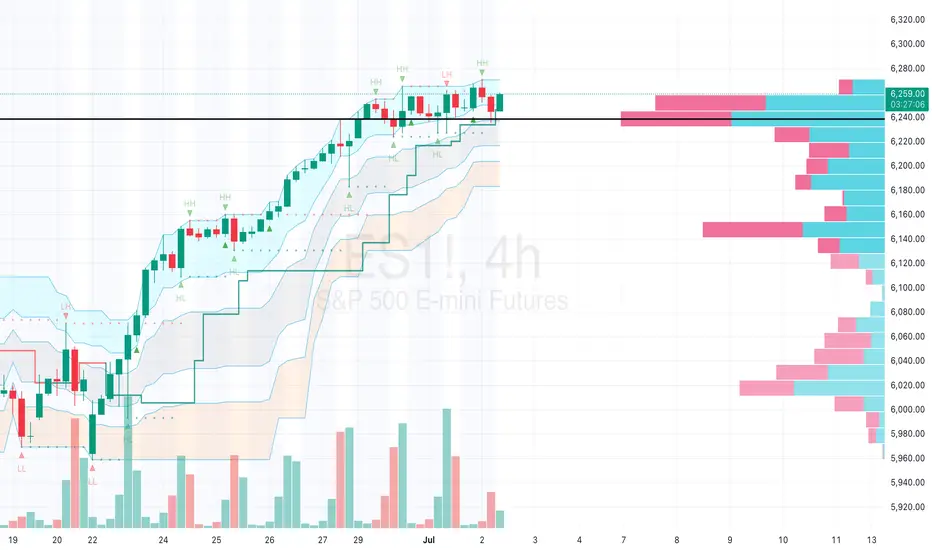
The S&P 500 E-Mini Futures (ES) is currently trading at 6,240.00, with a high of 6,259.00 and a low of 6,244.75, based on the 4-hour chart provided.
The price is approaching a significant resistance level around 6,240–6,259, where recent selling pressure is evident from the volume profile.
The market has shown a strong upward trend, with higher highs (HH) and higher lows (HL) forming since the last major low near 6,020, but momentum appears to be slowing.
Technical Analysis
Price Action: The chart indicates a consolidation phase near the current level of 6,240.00, following a rally from the support zone around 6,020–6,040. The recent red candles suggest a potential reversal or pause in the uptrend.
Volume Profile: The right-hand volume profile shows high volume nodes (HVNs) between 6,180 and 6,240, with the point of control (POC) near 6,220–6,240. This indicates strong trader interest and a potential support/resistance zone. The pink bars (selling volume) dominate above 6,240, signaling rejection at higher levels.
Support and Resistance:
Support: 6,220–6,240 (POC), with a deeper support at 6,180–6,200 if the price breaks lower.
Resistance: 6,259 (recent high), with a psychological barrier at 6,300 if bullish momentum resumes.
Indicators: The chart includes Market Profile levels (e.g., HH, HL, LH, LL), suggesting a structured approach to identifying value areas. The flattening of the value area suggests a lack of directional conviction at present.
Market Context
The ES has been influenced by mixed economic data, including the June 2025 ADP employment report, which reported a loss of 33,000 jobs, signaling potential economic slowdown. This could pressure equity markets, including the S&P 500.
The upcoming Nonfarm Payrolls report on July 03, 2025, is a critical event. A weaker-than-expected result (forecasted at 110,000 jobs) could increase bearish pressure, while a strong report might push the ES toward new highs.
Recent market performance (e.g., NASDAQ 100 weakness due to Tesla news) may also be impacting the broader index, though the S&P 500 has shown relative resilience.
Join my trading community on Discord! 📈 Use all our indicators for FREE
discord.gg/xPEDcNEupw
discord.gg/xPEDcNEupw
Disclaimer
The information and publications are not meant to be, and do not constitute, financial, investment, trading, or other types of advice or recommendations supplied or endorsed by TradingView. Read more in the Terms of Use.