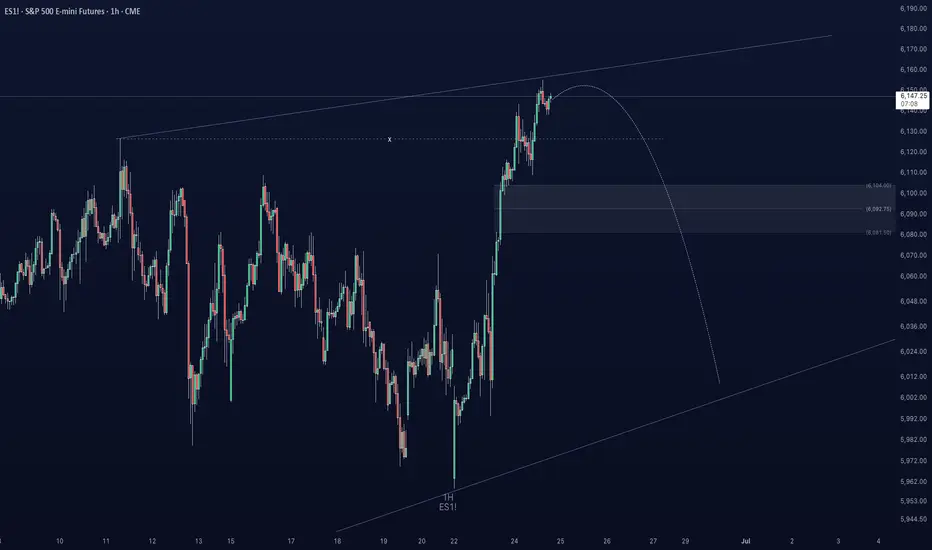
📊 Chart Analysis: ES1! (S&P 500 E-mini Futures, 1H) – Impending Breakdown via iFVG and Rising Wedge Top
This chart represents a technical analysis setup for ES1! (S&P 500 E-mini Futures) on the 1-hour timeframe. Here’s a contextual breakdown pointing toward a potential “rug pull” scenario by the end of the week, driven by an internal Fair Value Gap (iFVG) rejection and wedge resistance structure:
⸻
🔺 Structure Overview: Rising Wedge and Distribution Top
• The price action is following a rising wedge, which is typically a bearish reversal pattern, especially when occurring after a strong impulse move.
• The wedge’s upper trendline has just been tagged or slightly breached, with price showing early signs of rejection (small-bodied candles, wicks).
• A parabolic curve is drawn projecting a rounded top, suggesting buyers may be exhausting into resistance.
⸻
🧩 Internal Fair Value Gap (iFVG) in Focus
• The shaded gray area below current price action marks an iFVG (Internal Fair Value Gap) – a low-volume inefficiency formed during the recent bullish rally.
• iFVGs often act as magnetic zones, pulling price back to “rebalance” before continuation or reversal.
• Price has not yet filled this inefficiency completely, indicating a likely retracement target.
⸻
📉 Projected Breakdown Path
The curve implies a rounded top formation, with the following potential sequence:
1. Minor liquidity grab just above the wedge resistance.
2. Failure to hold above resistance confirms a deviation and traps late longs.
3. Sharp drop into the iFVG zone (gray block).
4. If iFVG support fails, acceleration toward the lower wedge trendline could follow — a true rug pull scenario.
⸻
🔻 Bearish Confluence Factors
• Volume divergence or lack of sustained momentum at highs (not visible here, but implied).
• The steepness of the rally suggests FOMO-driven buying, often vulnerable to reversal.
• The price has extended significantly from the last consolidation base, creating air pockets below.
• Candle structure shows upper wicks and rejection tails, signaling supply.
⸻
🗓️ Timing Bias – Into Week’s End
• Given the tightness of the wedge and proximity to iFVG + overhead resistance, any retracement could be swift and violent, particularly if driven by macro catalyst or profit-taking.
• Expectation would be a breakdown into Thursday or Friday, aligning with common volatility windows (e.g., weekly options expiry).
⸻
🔚 Summary
• Bias: Bearish (short-term)
• Trigger: Rejection of wedge high / deviation above resistance
• Targets:
• Primary: Fill of iFVG (gray zone)
• Secondary: Breakdown to lower wedge support
• Invalidation: Sustained acceptance above wedge trendline with bullish continuation
Disclaimer
The information and publications are not meant to be, and do not constitute, financial, investment, trading, or other types of advice or recommendations supplied or endorsed by TradingView. Read more in the Terms of Use.
Disclaimer
The information and publications are not meant to be, and do not constitute, financial, investment, trading, or other types of advice or recommendations supplied or endorsed by TradingView. Read more in the Terms of Use.
