Price is Knocking on the Door of All-Time Highs
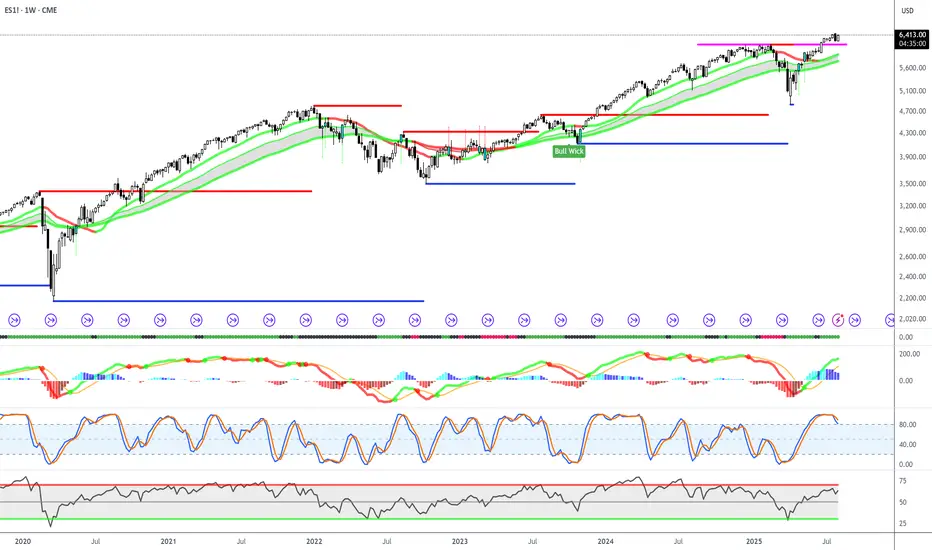
The bulls are back in control. Price is pushing above the 6,400 magenta resistance, a level that has capped rallies before — and we’re now testing it head-on. The uptrend from the late-2022 low remains strong, with price riding comfortably above the green moving average ribbon like a surfer on a perfect wave.
The last big pullback in early 2024? It was a clean bounce off the 4,000–4,100 blue support zone, marked by a textbook "Bull Wick" reversal candle. That move lit the fuse for a powerful rally, and the setup now has a similar feel.
Key Levels I’m Watching
Resistance: 6,400 (magenta) – in play right now.
Support: 5,600 (red), 4,300 (blue), and a deeper 3,800 zone (blue).
History shows that breakouts above major resistance here have triggered multi-week runs.
The Indicator Story
MACD: Bullish crossover forming, histogram shifting into positive territory → momentum is building.
Stochastic RSI: Tapped overbought and curling slightly down → short-term cooling possible.
RSI: Near 70, still in bullish territory and not yet screaming overbought.
The Bigger Picture
On the weekly chart, the trend is undeniably strong. Price is above all major moving averages, and momentum is on the bulls' side.
However, with multiple oscillators sitting high, the market might need to catch its breath — either through a small pullback or sideways consolidation — before launching into the next leg higher.
Bottom Line
The breakout is here, but confirmation is key. A strong push and close above 6,400 could open the door to another sustained rally. If the breakout fails, I’ll be watching the 5,600–5,400 range for signs of buyer defense.
Note
ATH hit at 6470.Disclaimer
The information and publications are not meant to be, and do not constitute, financial, investment, trading, or other types of advice or recommendations supplied or endorsed by TradingView. Read more in the Terms of Use.
Disclaimer
The information and publications are not meant to be, and do not constitute, financial, investment, trading, or other types of advice or recommendations supplied or endorsed by TradingView. Read more in the Terms of Use.