1. Definition and Importance
SMT (Smart Money Technique) Divergence refers to a trading concept that involves identifying discrepancies between the price movement of correlated markets or instruments.
These discrepancies can signal potential market reversals or price manipulation. Specifically, it focuses on the divergence between price movements and indicators (like volume, momentum, or oscillators) in markets that typically move in sync.

In SMT Divergence, traders look for situations where two or more correlated instruments (like
Forex pairs, indices, or bonds) are moving in opposite directions. This "divergence" signals that
there may be a shift in market sentiment, liquidity manipulation, or an opportunity for price
correction.
The importance of SMT Divergence lies in its ability to detect hidden market dynamics that are
often manipulated by institutional players. By understanding these divergences, traders can
gain insights into potential market moves and position themselves accordingly.
2. The Relationship Between Correlated Markets
Understanding these relationships is crucial for identifying SMT Divergence:
3. SMT Types
3.1. Bullish SMT Divergence
Bullish SMT (Smart Money Technique) Divergence occurs when one correlated asset forms a
higher low while another makes a lower low. This indicates that one market is showing hidden
strength, suggesting a potential reversal to the upside.

How to Spot Higher Lows in One Asset While the Other Makes Lower Lows:
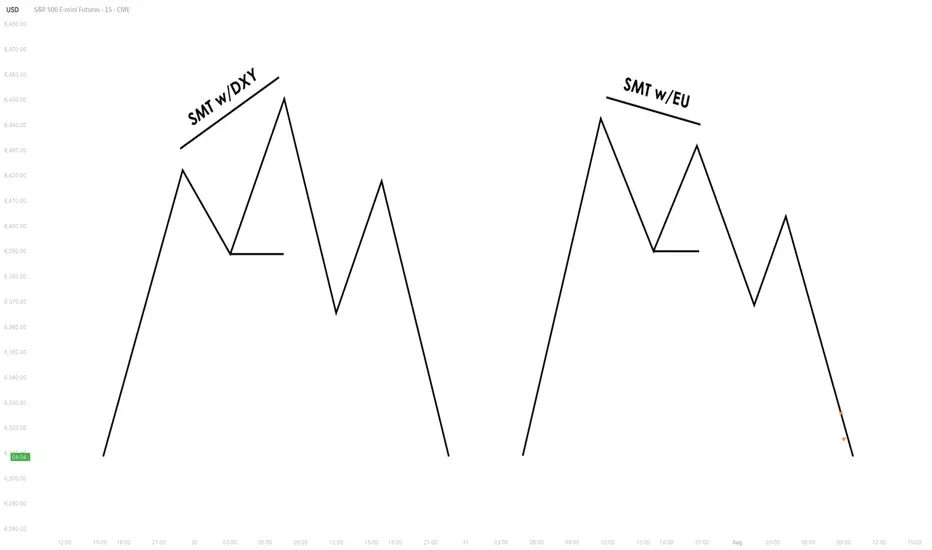
3.2. Bearish SMT Divergence
Bearish SMT Divergence occurs when one correlated asset forms a lower high while another
makes a higher high. This signals hidden weakness, indicating that the market may be setting
up for a bearish reversal.

How to Spot Lower Highs in One Asset While the Other Makes Higher Highs:
3.3. Intermarket SMT
Definition: Divergence between assets from different markets, such as Forex vs. Commodities, Stocks vs. Bonds, or Indices vs. the U.S. Dollar.

Examples:
Strength & Validity:
3.4. Intramarket SMT
Definition: Divergence within the same market (e.g., multiple Forex pairs or stock indices).
Examples:
Strength & Validity:
4. SMT Divergence vs. RSI Divergence

Why SMT Is Superior to Traditional RSI Divergences
How Smart Money Manipulates Classic Divergence Traders
5. Using TradingView for SMT Analysis
To effectively analyze SMT divergence, traders should monitor at least two correlated assets
simultaneously.

TradingView makes this easy by allowing multiple chart layouts. Steps to Set Up Multiple Charts in TradingView:
Best Pairs to Compare for SMT Analysis:
6. Key Takeaways
SMT (Smart Money Technique) Divergence refers to a trading concept that involves identifying discrepancies between the price movement of correlated markets or instruments.
These discrepancies can signal potential market reversals or price manipulation. Specifically, it focuses on the divergence between price movements and indicators (like volume, momentum, or oscillators) in markets that typically move in sync.
In SMT Divergence, traders look for situations where two or more correlated instruments (like
Forex pairs, indices, or bonds) are moving in opposite directions. This "divergence" signals that
there may be a shift in market sentiment, liquidity manipulation, or an opportunity for price
correction.
The importance of SMT Divergence lies in its ability to detect hidden market dynamics that are
often manipulated by institutional players. By understanding these divergences, traders can
gain insights into potential market moves and position themselves accordingly.
2. The Relationship Between Correlated Markets
Understanding these relationships is crucial for identifying SMT Divergence:
- Forex Pairs: Many Forex pairs have direct correlations. For example, EUR/USD and USD/JPY are often correlated in the sense that when the USD strengthens, both pairs may exhibit price movement in the same direction (EUR/USD decreases, USD/JPY increases). SMT
Divergence occurs when these pairs move in opposite directions, indicating that something
unusual is happening in the market (e.g., liquidity manipulation or market anticipation). - Indices: Stock market indices (like the S&P 500 or Dow Jones) and related instruments like futures or ETFs can show correlation. A divergence in these indices might indicate potential
trends or reversals, signaling that institutions are positioning themselves for a move in one
direction, and the market is showing resistance. - Bonds: The relationship between bond yields and currency pairs, for instance, can also show correlations. When bond yields move in one direction, certain currency pairs should
generally follow suit. Divergence in this relationship can reveal clues about market
intentions, such as shifts in interest rates or macroeconomic sentiment. - Commodities and Stocks: Commodities like oil and gold can often correlate with indices or specific stocks. For example, if oil prices rise and an energy sector index doesn’t move in the
same direction, this could be a sign of market inefficiencies or institutional positioning.
3. SMT Types
3.1. Bullish SMT Divergence
Bullish SMT (Smart Money Technique) Divergence occurs when one correlated asset forms a
higher low while another makes a lower low. This indicates that one market is showing hidden
strength, suggesting a potential reversal to the upside.
How to Spot Higher Lows in One Asset While the Other Makes Lower Lows:
- 1. Identify Two Correlated Markets – Choose two assets that typically move together, such as EUR/USD and GBP/USD or NASDAQ and S&P 500.
- 2. Look for Divergence – Observe when one asset makes a new lower low, while the other fails to do so, instead of forming a higher low.
- 3. Volume & Price Action Confirmation – Institutions may absorb liquidity in the weaker asset while the stronger one holds its ground.
- 4. Validate with Market Context – Look at macroeconomic conditions, liquidity pools, and institutional activity to confirm the setup.
3.2. Bearish SMT Divergence
Bearish SMT Divergence occurs when one correlated asset forms a lower high while another
makes a higher high. This signals hidden weakness, indicating that the market may be setting
up for a bearish reversal.
How to Spot Lower Highs in One Asset While the Other Makes Higher Highs:
- 1. Find Two Correlated Markets – Common pairs include NASDAQ vs. S&P 500 or EUR/USD vs. GBP/USD.
- 2. Identify the Divergence – One asset makes a higher high, while the other fails to follow and forms a lower high instead.
- 3. Liquidity & Volume Analysis – Smart money may be using the stronger asset to attract buyers before reversing.
- 4. Confirm with Institutional Order Flow – Watch for liquidity grabs and imbalance zones.
3.3. Intermarket SMT
Definition: Divergence between assets from different markets, such as Forex vs. Commodities, Stocks vs. Bonds, or Indices vs. the U.S. Dollar.
Examples:
- EUR/USD vs. DXY (U.S. Dollar Index) – If EUR/USD forms a higher low while DXY makes a
higher high, this suggests USD weakness and potential EUR/USD strength. - NASDAQ vs. S&P 500 – If NASDAQ makes a higher high but S&P 500 doesn’t, it can indicate
a weakening stock market rally.
Strength & Validity:
- High validity because institutions hedge positions across different markets.
3.4. Intramarket SMT
Definition: Divergence within the same market (e.g., multiple Forex pairs or stock indices).
Examples:
- EUR/USD vs. GBP/USD – If EUR/USD makes a lower low but GBP/USD doesn’t, it could
indicate bullish strength. - Dow Jones vs. S&P 500 vs. NASDAQ – If NASDAQ is making new highs while the Dow lags, it
may signal weakness in the broader stock market.
Strength & Validity:
- Still valid but needs additional confirmation (liquidity sweeps, volume analysis).
4. SMT Divergence vs. RSI Divergence
Why SMT Is Superior to Traditional RSI Divergences
- 1. RSI Measures Momentum, Not Liquidity – RSI divergence is based on momentum shifts,
which institutions can easily manipulate with fake breakouts or engineered price moves. - 2. SMT Focuses on Market Structure & Liquidity – SMT divergence detects institutional
positioning by comparing correlated assets, making it harder to manipulate. - 3. RSI Can Remain Overbought/Oversold for Long Periods – Markets can continue trending
despite RSI divergence, while SMT divergence often provides stronger reversal signals.
How Smart Money Manipulates Classic Divergence Traders
- Liquidity Sweeps – Institutions use RSI divergence to lure retail traders into premature
reversals before executing stop hunts. - False RSI Signals – In trending markets, RSI divergences often fail, while SMT divergence
provides a more contextual view of smart money positioning.
5. Using TradingView for SMT Analysis
To effectively analyze SMT divergence, traders should monitor at least two correlated assets
simultaneously.
TradingView makes this easy by allowing multiple chart layouts. Steps to Set Up Multiple Charts in TradingView:
- a. Open TradingView and click on the “Select Layout” button.
- b. Choose a two-chart or four-chart layout to compare correlated assets.
- c. Sync timeframes across all charts for consistency.
- d. Adjust scaling to ensure price action is easily comparable.
Best Pairs to Compare for SMT Analysis:
- Forex: EUR/USD vs. GBP/USD, USD/JPY vs. DXY
- Indices: NASDAQ vs. S&P 500, Dow Jones vs. S&P 500
- Commodities & FX: Gold (XAU/USD) vs. USD/JPY
- Bonds & Equities: 10-Year Treasury Yield vs. S&P 500
6. Key Takeaways
- SMT divergence reveals institutional intent by showing liquidity accumulation or
distribution through correlated assets. - Bullish SMT occurs when one asset makes a lower low while the other does not, signaling a
potential reversal up. - Bearish SMT occurs when one asset makes a higher high while the other does not, signaling
a potential reversal down. - Best markets for SMT analysis include Forex pairs, indices, commodities, and bonds, where
correlations are strongest. - SMT is most effective near key liquidity levels, such as session highs/lows, order blocks, and
fair value gaps. - SMT is more reliable during high-impact news events, London & New York sessions, and
quarterly shifts, where institutional activity is highest. - SMT is superior to RSI divergence because it reflects real liquidity dynamics, whereas RSI
can produce false signals. - Combining SMT with market structure shifts like BOS and CHoCH increases trade accuracy
and reliability. - Risk management in SMT trading requires stop-loss placement beyond liquidity grabs and a
minimum 2:1 risk-reward ratio. - Mastering SMT helps traders avoid liquidity traps, improve precision, and align with smart
- money moves.
SMT divergence is the footprint of smart money—where one market whispers the truth while the other follows the herd.
Get access to our exclusive tools: candelacharts.com
Join our community: discord.gg/etGSTepqbu
All content provided by CandelaCharts is for informational & educational purposes only.
Join our community: discord.gg/etGSTepqbu
All content provided by CandelaCharts is for informational & educational purposes only.
Disclaimer
The information and publications are not meant to be, and do not constitute, financial, investment, trading, or other types of advice or recommendations supplied or endorsed by TradingView. Read more in the Terms of Use.