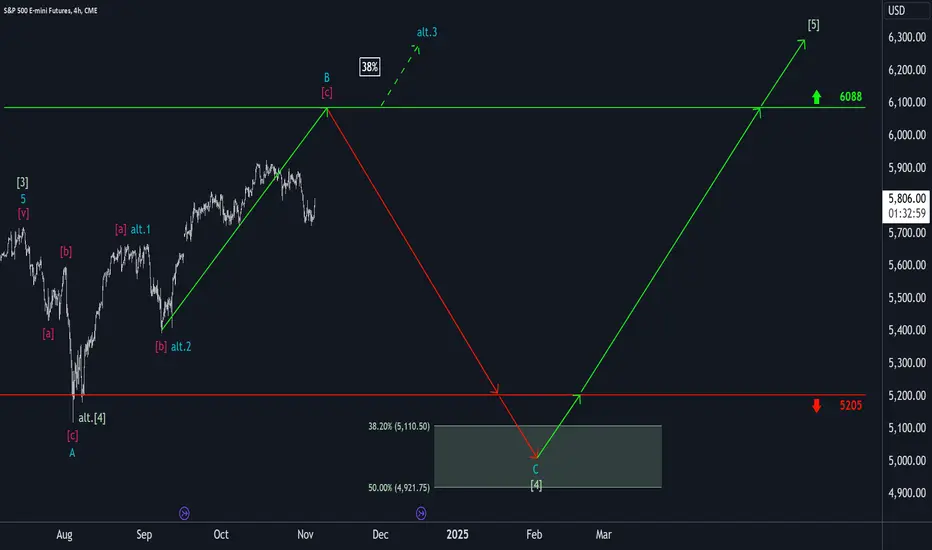
We still ascribe more upward potential to the S&P’s turquoise wave B – up to the resistance at 6088 points. At this level, we expect a transition into the same-colored wave C, which should push the index down into our green Target Zone between 5110 and 4921 points. Within this Zone, the larger wave [4] should find its final low, which should provide potential entry points for long positions. A stop-loss can be set 1% below this Zone for risk management. However, if the index surpasses the 6088 points mark directly, our alternative scenario (probability: 38%) will come into play: it suggests that the wave [4] low is already in place.
📊 Free daily market insights combining macro + Elliott Wave analysis
🚀 Spot trends early with momentum, sentiment & price structure
🌐 Join thousands trading smarter - full free analyses at dailymarketupdate.com
🚀 Spot trends early with momentum, sentiment & price structure
🌐 Join thousands trading smarter - full free analyses at dailymarketupdate.com
Related publications
Disclaimer
The information and publications are not meant to be, and do not constitute, financial, investment, trading, or other types of advice or recommendations supplied or endorsed by TradingView. Read more in the Terms of Use.