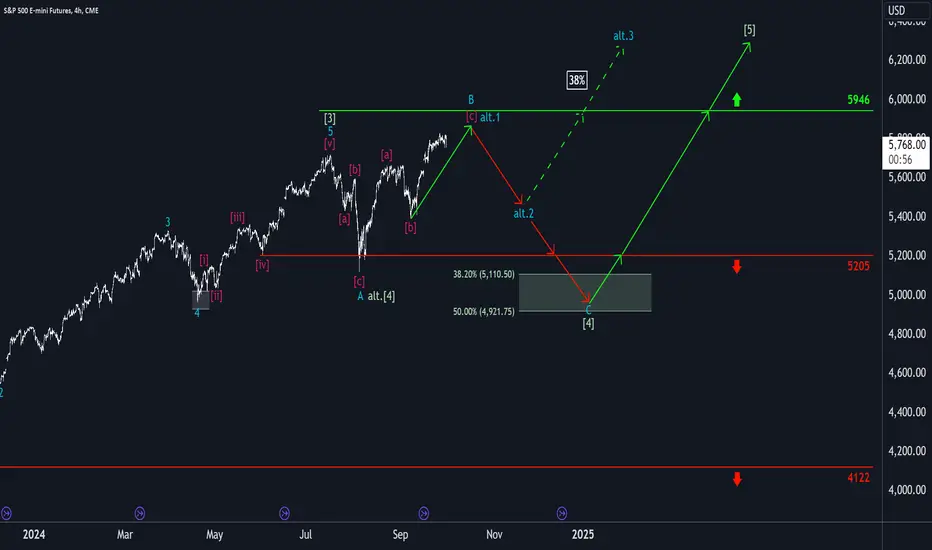
We still give the S&P more room and time to complete its turquoise wave B, which should primarily peak below the resistance at 5946 points. If the index breaches this level, we will have to assume that the larger green wave alt.(4) has already bottomed out. We consider this alternative scenario 38% likely. However, we primarily expect the S&P to fall into our green Target Zone (coordinates: 5110 – 4921 points) after reaching the upcoming top of wave B. This range is where the regular green wave (4) should be completed. Thereafter, we expect the upward movement to continue, with wave (5) finally breaking above 5946 points.
📊 Free daily market insights combining macro + Elliott Wave analysis
🚀 Spot trends early with momentum, sentiment & price structure
🌐 Join thousands trading smarter - full free analyses at dailymarketupdate.com
🚀 Spot trends early with momentum, sentiment & price structure
🌐 Join thousands trading smarter - full free analyses at dailymarketupdate.com
Disclaimer
The information and publications are not meant to be, and do not constitute, financial, investment, trading, or other types of advice or recommendations supplied or endorsed by TradingView. Read more in the Terms of Use.