Short until the gap, then long.
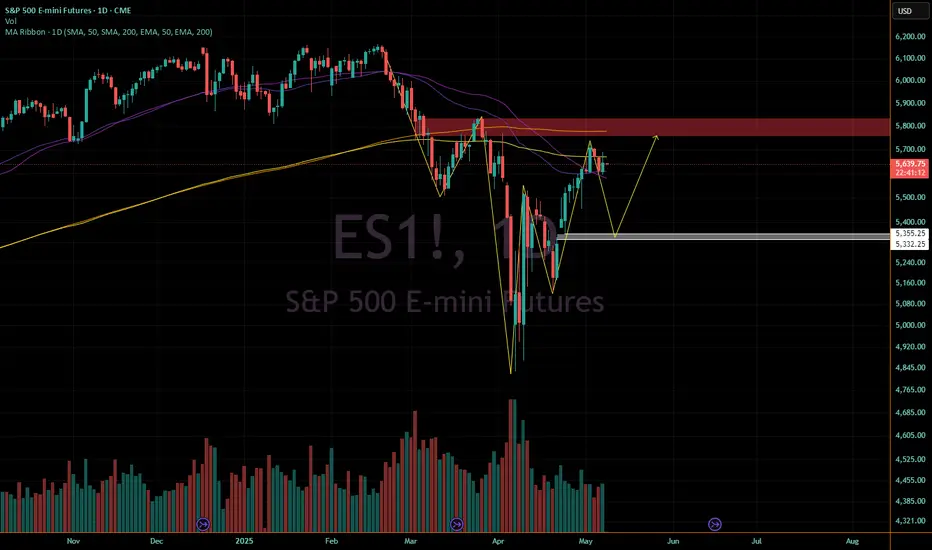
Daily S&P E-mini futures chart, a failure to remain above the 200 EMA and failure to reach the 200 MA, now pushing on the 50 EMA and MA and a confirmed death cross.
We have a CME gap between 5332-5355 (so approx 5345ish as a target).
Scenario here is a move down to the gap to act as a springboard to get back above the 50/200 EMAs and MAs and have it cross back over.
Resistance area aligns with 200 MA.
Pattern formed looks like an inverted HS or possibly a quasimodo.
Disclaimer
The information and publications are not meant to be, and do not constitute, financial, investment, trading, or other types of advice or recommendations supplied or endorsed by TradingView. Read more in the Terms of Use.
Disclaimer
The information and publications are not meant to be, and do not constitute, financial, investment, trading, or other types of advice or recommendations supplied or endorsed by TradingView. Read more in the Terms of Use.