Can someone explain to me why the monthly chart of ES looks exactly like what happened today June 9th 2023 on the 3 min chart?
Perhaps this is a warning of what is to come
Perhaps this is a warning of what is to come
Note
Chart of the 3 minuteCan you tell the difference?
Note
Note
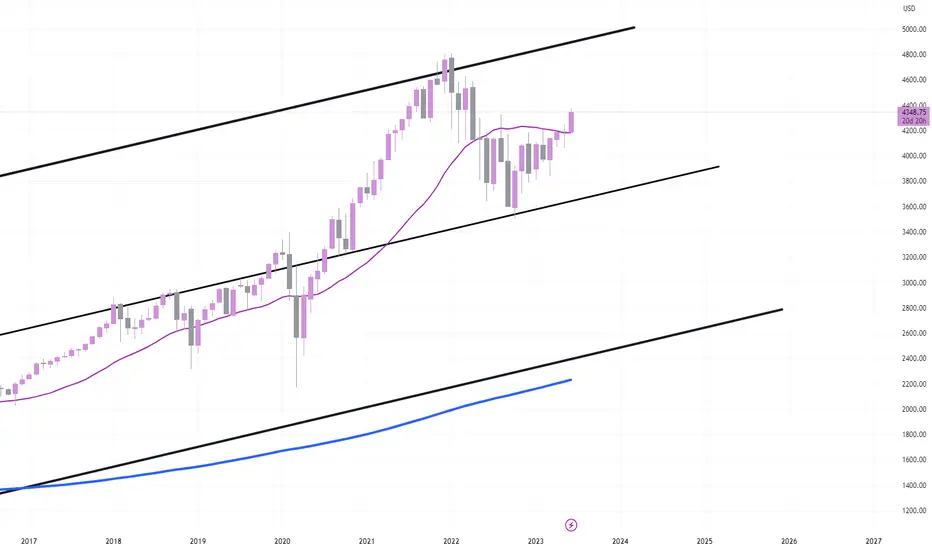
Possible projection of How SP500 will look likeNote
Looks like possible false break of the lower upper trend line at around 2400Note
3 Minute on the leftMonthly on the right
Disclaimer
The information and publications are not meant to be, and do not constitute, financial, investment, trading, or other types of advice or recommendations supplied or endorsed by TradingView. Read more in the Terms of Use.
Disclaimer
The information and publications are not meant to be, and do not constitute, financial, investment, trading, or other types of advice or recommendations supplied or endorsed by TradingView. Read more in the Terms of Use.