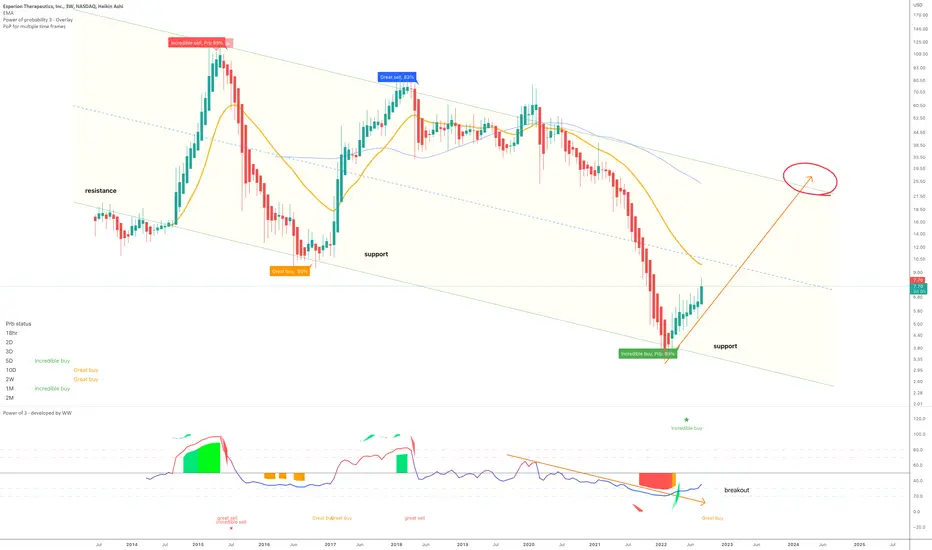
On the above 3-week chart price action for Esperion Therapeutics has collapsed over 90% since the sell signal in early 2018. Now is an excellent moment to be dollar cost averaging into a long position. Why?
1) A fantastic ‘buy’ signal. Remember this is a 3-week chart. Very powerful on this scale, look left.
2) Long term price action and RSI resistance breakouts.
3) The downtrend channel confirmed support. Look left. Expect price action to now continue until the upper channel resistance.
Is it possible price action falls? Sure, especially in the near term.
Is it probable? No.
Ww
Questions? Just ask below, I'm not invested nor trading this.
Type: Investment - Long anything below $7 and not before
Risk: <=6% of portfolio
Timeframe: 16 - 20 months
Return: 3x so far since support confirmation. Target $20-24
BTC
bc1q2eckdzh0q8vsd7swcc8et6ze7s99khhxyl7zwy
Weblink: patreon.com/withoutworries
Allow 3-6 months on ideas. Not investment advice. DYOR
bc1q2eckdzh0q8vsd7swcc8et6ze7s99khhxyl7zwy
Weblink: patreon.com/withoutworries
Allow 3-6 months on ideas. Not investment advice. DYOR
Disclaimer
The information and publications are not meant to be, and do not constitute, financial, investment, trading, or other types of advice or recommendations supplied or endorsed by TradingView. Read more in the Terms of Use.